Results & Reports
Read per-row results and metric summaries from a completed run, then export or build a report for the evidence you need.
Checking run status
run.status returns one of "pending", "running", "completed", "failed", or "cancelled" (the backend may report "complete", which the SDK treats as a synonym of "completed"). run.poll_status(interval, timeout) blocks until a terminal state and raises RunFailedError or RunCancelledError on failure. run.cancel() requests graceful cancellation of a run that hasn't finished. Rather than poll a long run yourself, you can subscribe to run-completion webhooks — see the Notifications feature (aip.NotificationConfig.create(...)), which delivers a signed event envelope when a run reaches a terminal state.
API
A GET /runs/<run_id> syncs and returns the run status.
curl -sS "$AIP_API_URL/runs/<run_id>" \
  -H "Authorization: Bearer $AIP_TOKEN"
Retrieving results and aggregated metrics
run.results(page=1, page_size=100) returns a RunResultsPage — the per-row scores and the aggregated metric summaries for the run. page_size must be between 1 and 1000; page server-side by incrementing page. Calling it before the run finishes raises RunNotCompleteError. The three result types are frozen dataclasses exported at the top level (from aip_sdk import ScoreResult, Metric, RunResultsPage):
RunResultsPage—.results(list[ScoreResult]),.metrics(list[Metric], repeated on every page),.total,.page,.page_size.ScoreResult— one entry per (input_id,scorer) pair:.input_id,.scorer,.score(float),.explanation(str | None),.config_identity(list[MetricConfigIdentity]— the stored config(s) that scorer resolved; empty if none was pinned or the platform predates this field).Metric— one aggregated entry per scorer:.scorer,.mean,.std,.count, and.pass_rate(fraction of rows at or above the scorer threshold,0.0–1.0).
For descriptive statistics and per-dimension breakdowns, run.analysis(group_by=None) returns a dict with run_id, row_count, dimension_columns, scorer_stats, and score_distribution — plus per-value group_stats when group_by names a dimension column.
SDK
page = run.results(page=1, page_size=100)
for r in page.results:
    print(r.input_id, r.scorer, r.score)
for m in page.metrics:
    print(f"{m.scorer}: mean={m.mean:.3f} pass_rate={m.pass_rate:.0%} (n={m.count})")

analysis = run.analysis(group_by="intent")
API
The /results endpoint returns paginated row-level output and the /analysis endpoint returns aggregated scorer stats plus histograms.
curl -sS "$AIP_API_URL/runs/<run_id>/results?page=1&page_size=100" \
  -H "Authorization: Bearer $AIP_TOKEN"
curl -sS "$AIP_API_URL/runs/<run_id>/analysis" \
  -H "Authorization: Bearer $AIP_TOKEN"
Listing runs (aip.list_runs, aip.iter_runs)
To enumerate past runs — for a project dashboard, or to find a run id to re-open — use aip.list_runs(). It returns RunSummary records (newest first), optionally filtered by project and status, and paginated. Each RunSummary is a read-only snapshot carrying .id, .pipeline, .status, .runner_mode, the project/dataset/SUT ids, .error, and the run timestamps; pass a summary's .id to aip.get_run() to attach to the run and read its results. status accepts any of pending | running | completed | failed | cancelled; page/per_page are validated at the boundary (InvalidArgumentError), and per_page is capped at 100.
Pass metric with metric_config_name/metric_config_version to filter to runs whose scoring snapshot for that metric resolved a specific stored config — metric and at least one config filter are each required by the other. aip.iter_runs() takes the same filters and auto-paginates, for sweeping every run pinning a config version (e.g. before retiring it) instead of paging by hand.
SDK
for summary in aip.list_runs(status="completed", per_page=50):
    print(summary.id, summary.pipeline, summary.status, summary.created_at)

# Attach to a listed run to read its results.
latest = aip.list_runs(project_id=project.id)[0]
page = aip.get_run(latest.id).results()

# Auto-paginate every run pinning a specific stored config.
for summary in aip.iter_runs(metric="agent.custom_judge_rubric", metric_config_name="rubric_prompt_a"):
    print(summary.id, summary.status)
Inspecting a past run (aip.get_run)
To re-open a run created earlier — for example yesterday's run — fetch it by id. The returned Run is not a new run and does not own the HTTP client, so you can call status, results(), and analysis() directly, outside any with block. results() still raises RunNotCompleteError until the run finishes.
In the example below, aip.get_run(run_id) attaches to the existing run, run.status reads its state (e.g. "completed"), run.results() returns a RunResultsPage, and run.analysis() returns the aggregated stats.
SDK
run = aip.get_run(run_id)
print(run.status)
page = run.results(page=1, page_size=100)
analysis = run.analysis(group_by="intent")
Diffing two runs (aip.diff)
Compare two completed runs row-by-row and export the full diff as CSV. aip.diff() accepts run ids or Run objects and returns a RunDiff handle; .export() streams the diff to a path or returns the CSV as bytes. Only format="csv" is supported; a 5xx or transport failure raises ResultsUnavailableError.
In the example, aip.diff(...) returns a RunDiff, run_diff.export(path="diff.csv") streams the CSV to disk and returns None, and calling export() with no path returns the CSV payload as bytes.
SDK
run_diff = aip.diff(run_a_id, run_b_id)
run_diff.export(path="diff.csv")
csv_bytes = run_diff.export()

# Narrow + sort server-side — the CSV contains only the matching, ordered rows
run_diff.export(
    path="diff.csv",
    row_status="new",  # matched | new | missing
    scorer_name=["accuracy", "relevance"],  # str or list of scorer names
    delta_min=0.1,  # bound the max abs per-scorer delta
    sort="accuracy__delta_desc",  # <dim>_asc / <dim>_desc
)
export() accepts optional narrowing params, applied server-side so the CSV
holds only the matching, sorted rows: row_status (matched/new/missing),
scorer_name (a scorer name or list — keep rows where any named scorer has a
score), delta_min/delta_max (bound the maximum absolute per-scorer delta),
and sort (<dimension>_asc/_desc, where <dimension> is input_id,
row_status, or a per-scorer column like accuracy__delta). An invalid filter
or sort value raises APIError (HTTP 400).
API
The raw API streams CSV from the /runs/diff/export endpoint; format=csv is the only supported format.
curl -sS "$AIP_API_URL/runs/diff/export?run_a=<run_a>&run_b=<run_b>&format=csv" \
  -H "Authorization: Bearer $AIP_TOKEN" -o diff.csv
Build and export a report
The Report Builder turns a completed evaluation run into a shareable, governance-grade report — cover page, scope, methodology, executive summary, detailed findings, and recommendations. The platform drafts it for you; you then customise what goes in, edit the prose right in the browser, and export a branded PDF. Open it from Reports in the left sidebar.
A report is generated asynchronously: you compose it in a short wizard, the platform queues a generation job, and the report appears in the list — first as Generating, then Completed or Failed. A completed report opens in an on-platform editor (not a static PDF), where your edits are saved back to the report and reflected in the export.
➡️ The Reports List
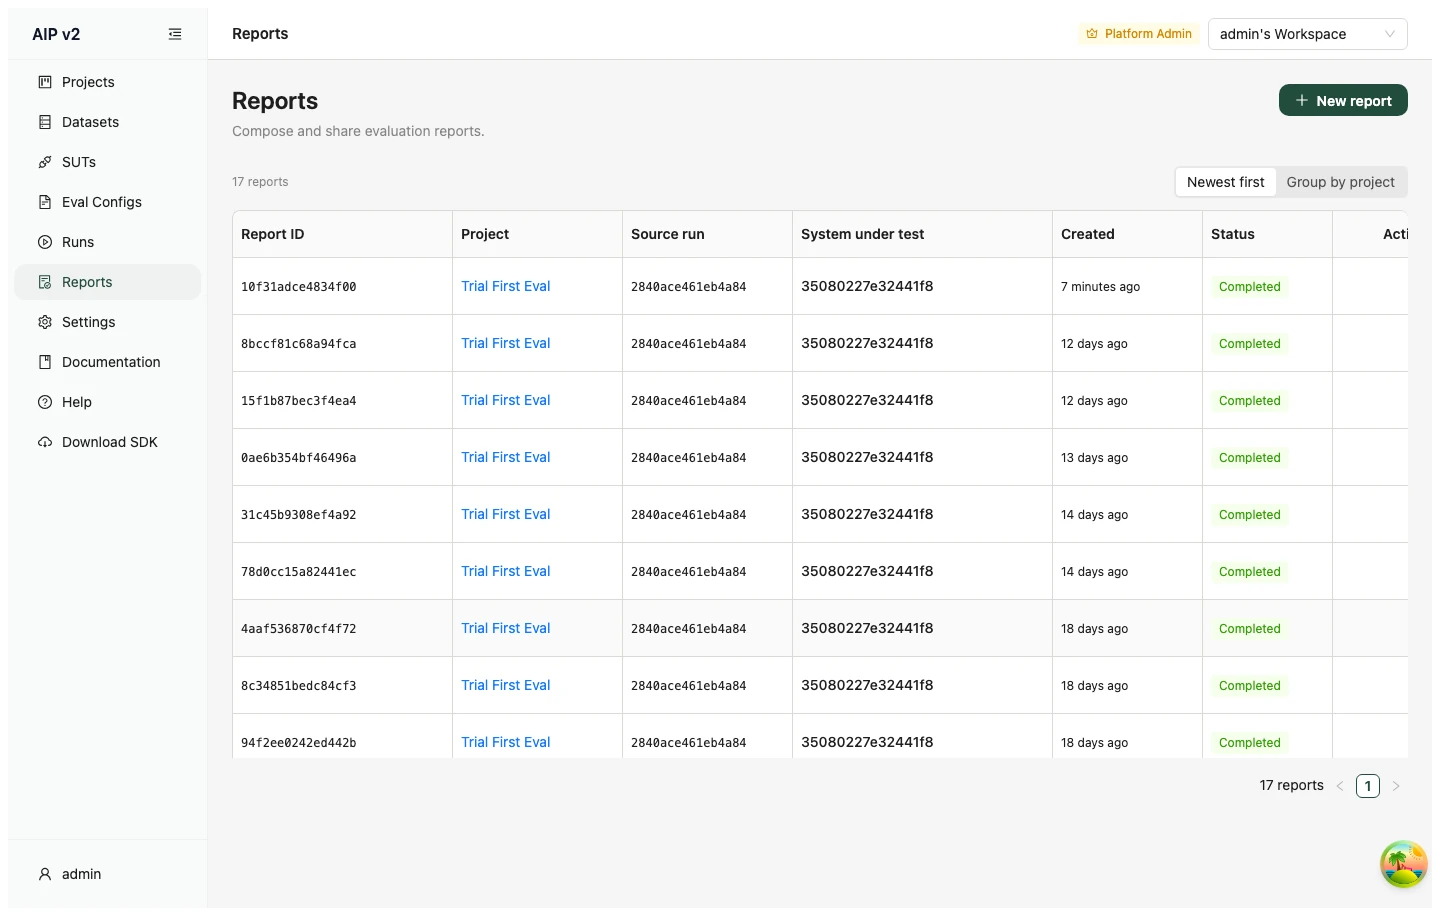
The Reports page lists every report, newest first — one per table row. Toggle Newest first / Group by project at the top right.
| Column | Meaning |
|---|---|
| Report ID | The report's identifier — a link once the report is ready to open (a plain label while it's still generating). |
| Source run | The completed run the report was built from — links through to that run. |
| System under test | The SUT captured at creation time (hover for the full name). |
| Created | Relative timestamp (hover for the exact time). |
| Status | The generation lifecycle (see below). |
| Actions | Open the report to view, edit, and export it. |
The Status tag tracks the generation job:
| Status | Colour | Meaning |
|---|---|---|
| Pending / Generating | blue (animated) | Still in flight — the list auto-refreshes until it finishes. |
| Completed | green | Ready to open in the editor and export. |
| Failed | red | Generation ended with no artefact — open it to see why. |
If there are no reports yet, an empty state invites you to generate one from a completed evaluation run. New report (top-right) opens the builder.
✳️ Creating a Report — the 3-Step Wizard
The New report button opens a three-step wizard — Report Setup → Report Content → Review & Edit — with the current step shown in the progress bar at the top.
Step 1 — Report Setup. Choose the source run, then choose which sections to include.
- Source run — a searchable picker of your completed runs (only completed evaluation runs can be reported on). Picking a run loads its question schema, which drives the rest of the form.
- Sections to include — the report is made of 9 sections (listed below). All are selected by default; clear the ones you don't need, and Select all / Clear all toggles the lot. The sections you keep determine which questions the next step asks — and are stamped into the report's provenance footer (see Export & Provenance).
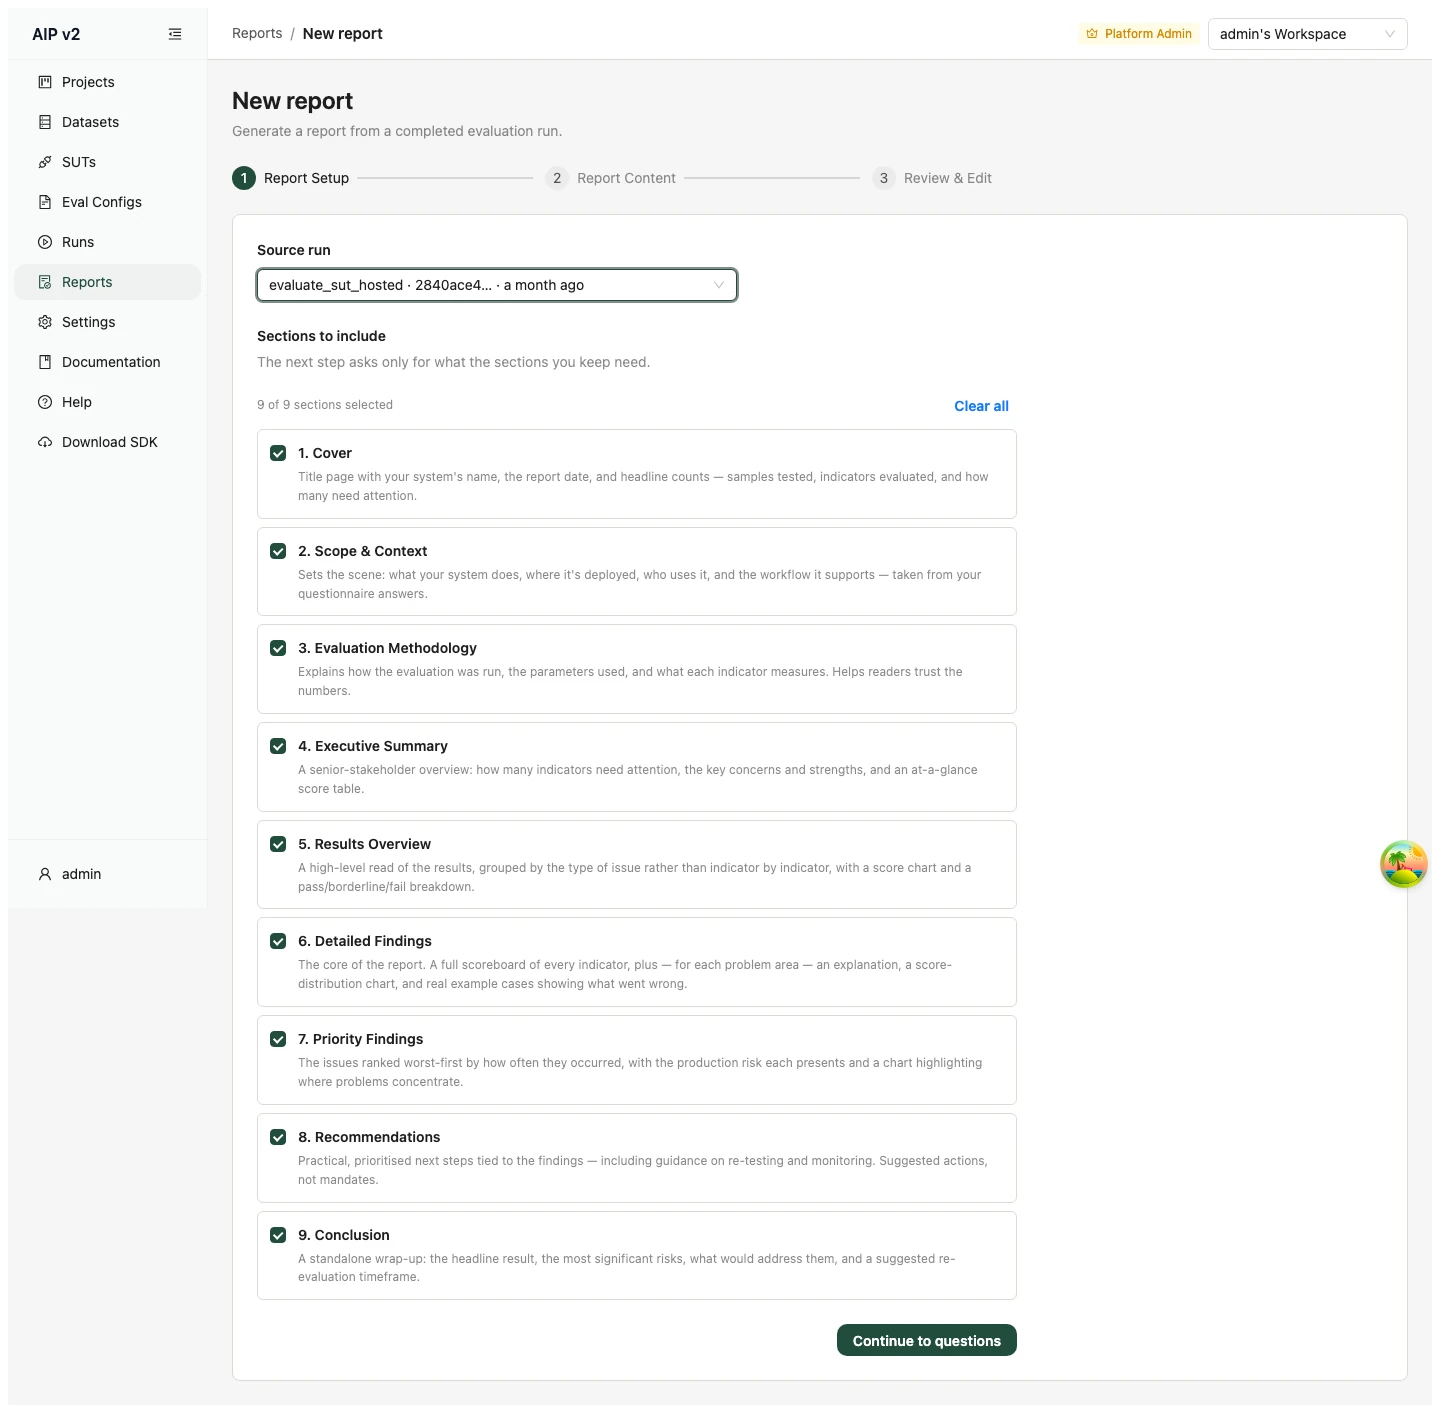
The nine sections, in report order:
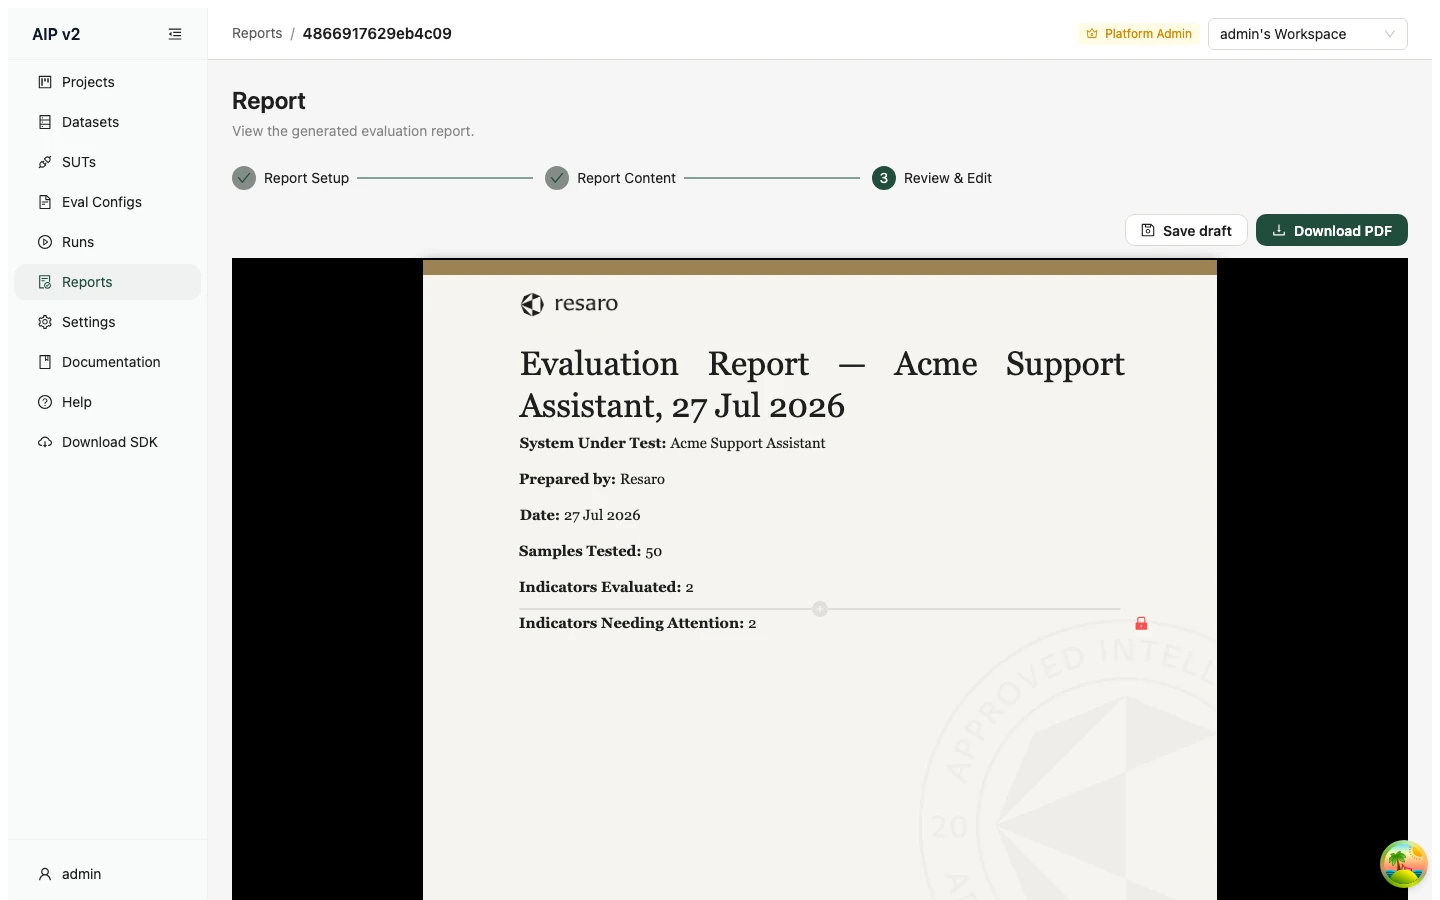
- Cover — Title page with your system's name, the report date, and headline counts — samples tested, indicators evaluated, and how many need attention.
- Scope & Context — Sets the scene: what your system does, where it's deployed, who uses it, and the workflow it supports — taken from your questionnaire answers.
- Evaluation Methodology — Explains how the evaluation was run, the parameters used, and what each indicator measures. Helps readers trust the numbers.
- Executive Summary — A senior-stakeholder overview: how many indicators need attention, the key concerns and strengths, and an at-a-glance score table.
- Results Overview — A high-level read of the results, grouped by the type of issue rather than indicator by indicator, with a score chart and a pass/borderline/fail breakdown.
- Detailed Findings — The core of the report: a full scoreboard of every indicator, plus — for each problem area — an explanation, a score-distribution chart, and real example cases showing what went wrong.
- Priority Findings — The issues ranked worst-first by how often they occurred, with the production risk each presents and a chart highlighting where problems concentrate.
- Recommendations — Practical, prioritised next steps tied to the findings — including guidance on re-testing and monitoring. Suggested actions, not mandates.
- Conclusion — A standalone wrap-up: the headline result, the most significant risks, what would address them, and a suggested re-evaluation timeframe.
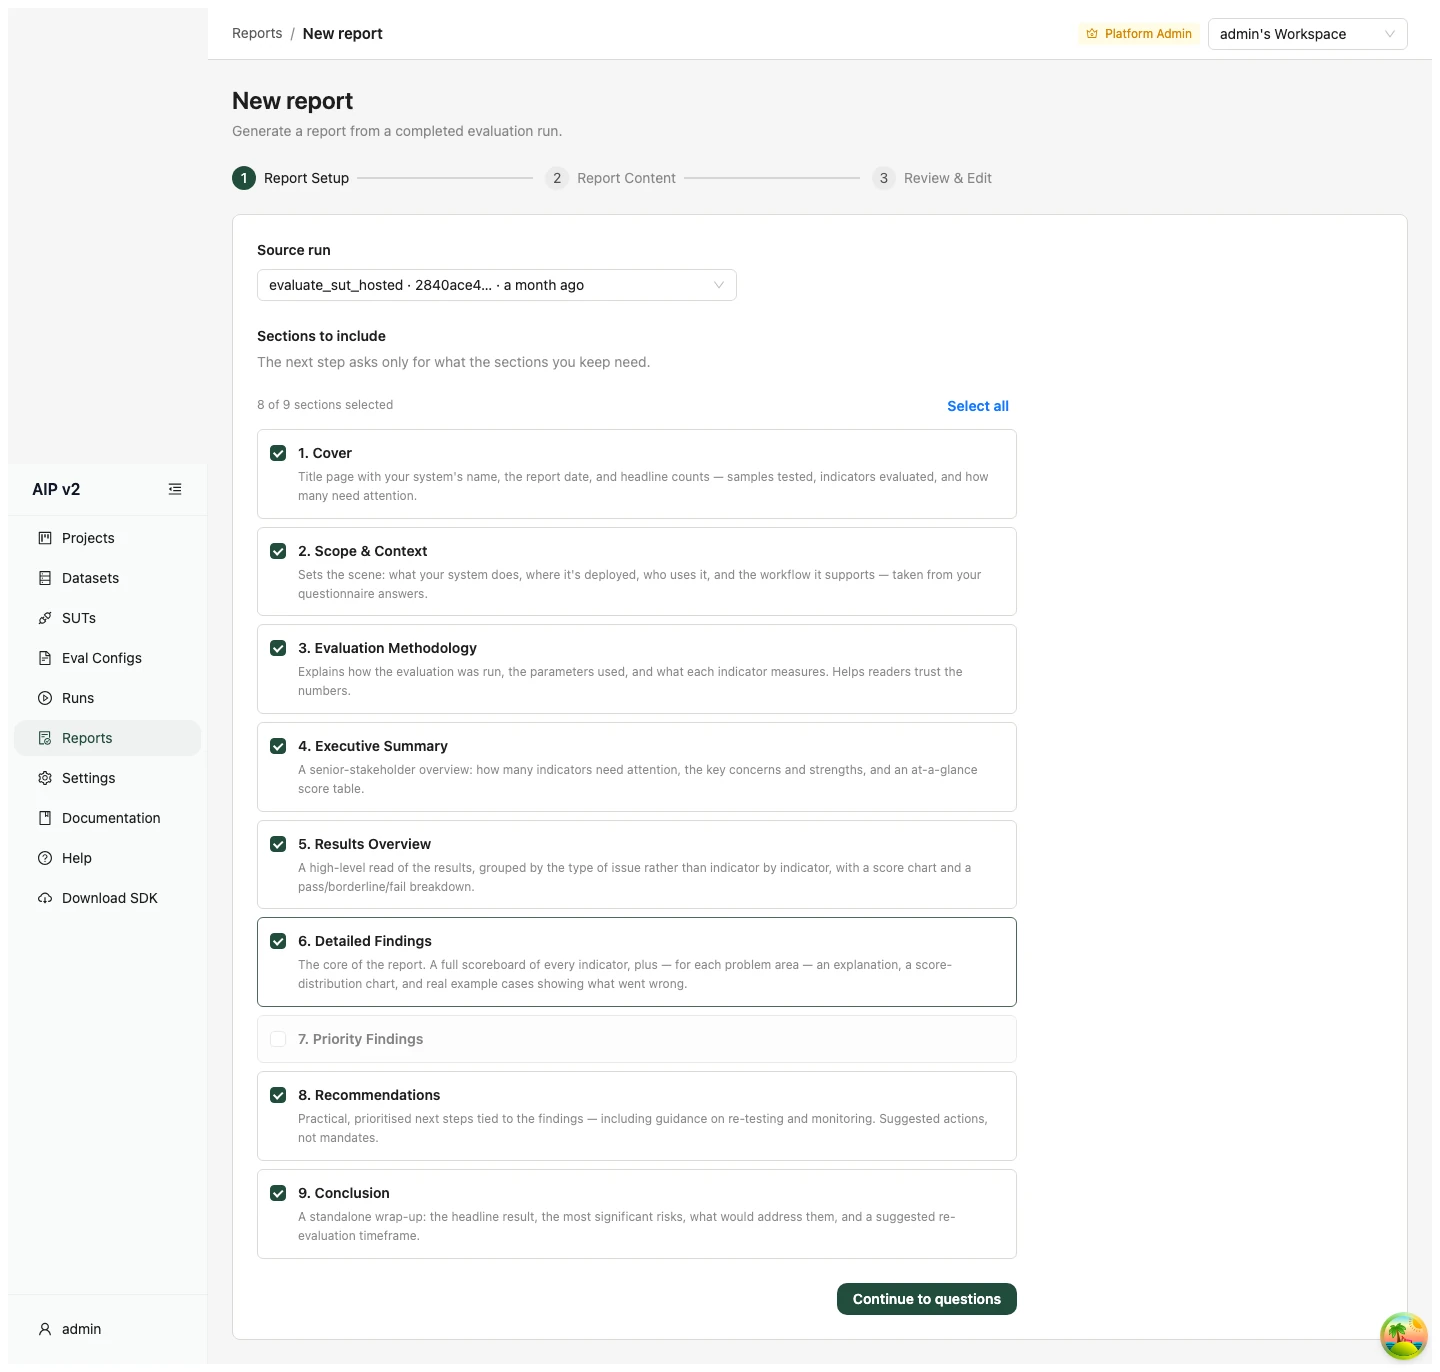
Deselecting a section folds it down to a dimmed header, so you can see at a glance what's in and what's out. Here Priority Findings has been cleared — a custom, 8-of-9 selection:
Click Continue to questions.
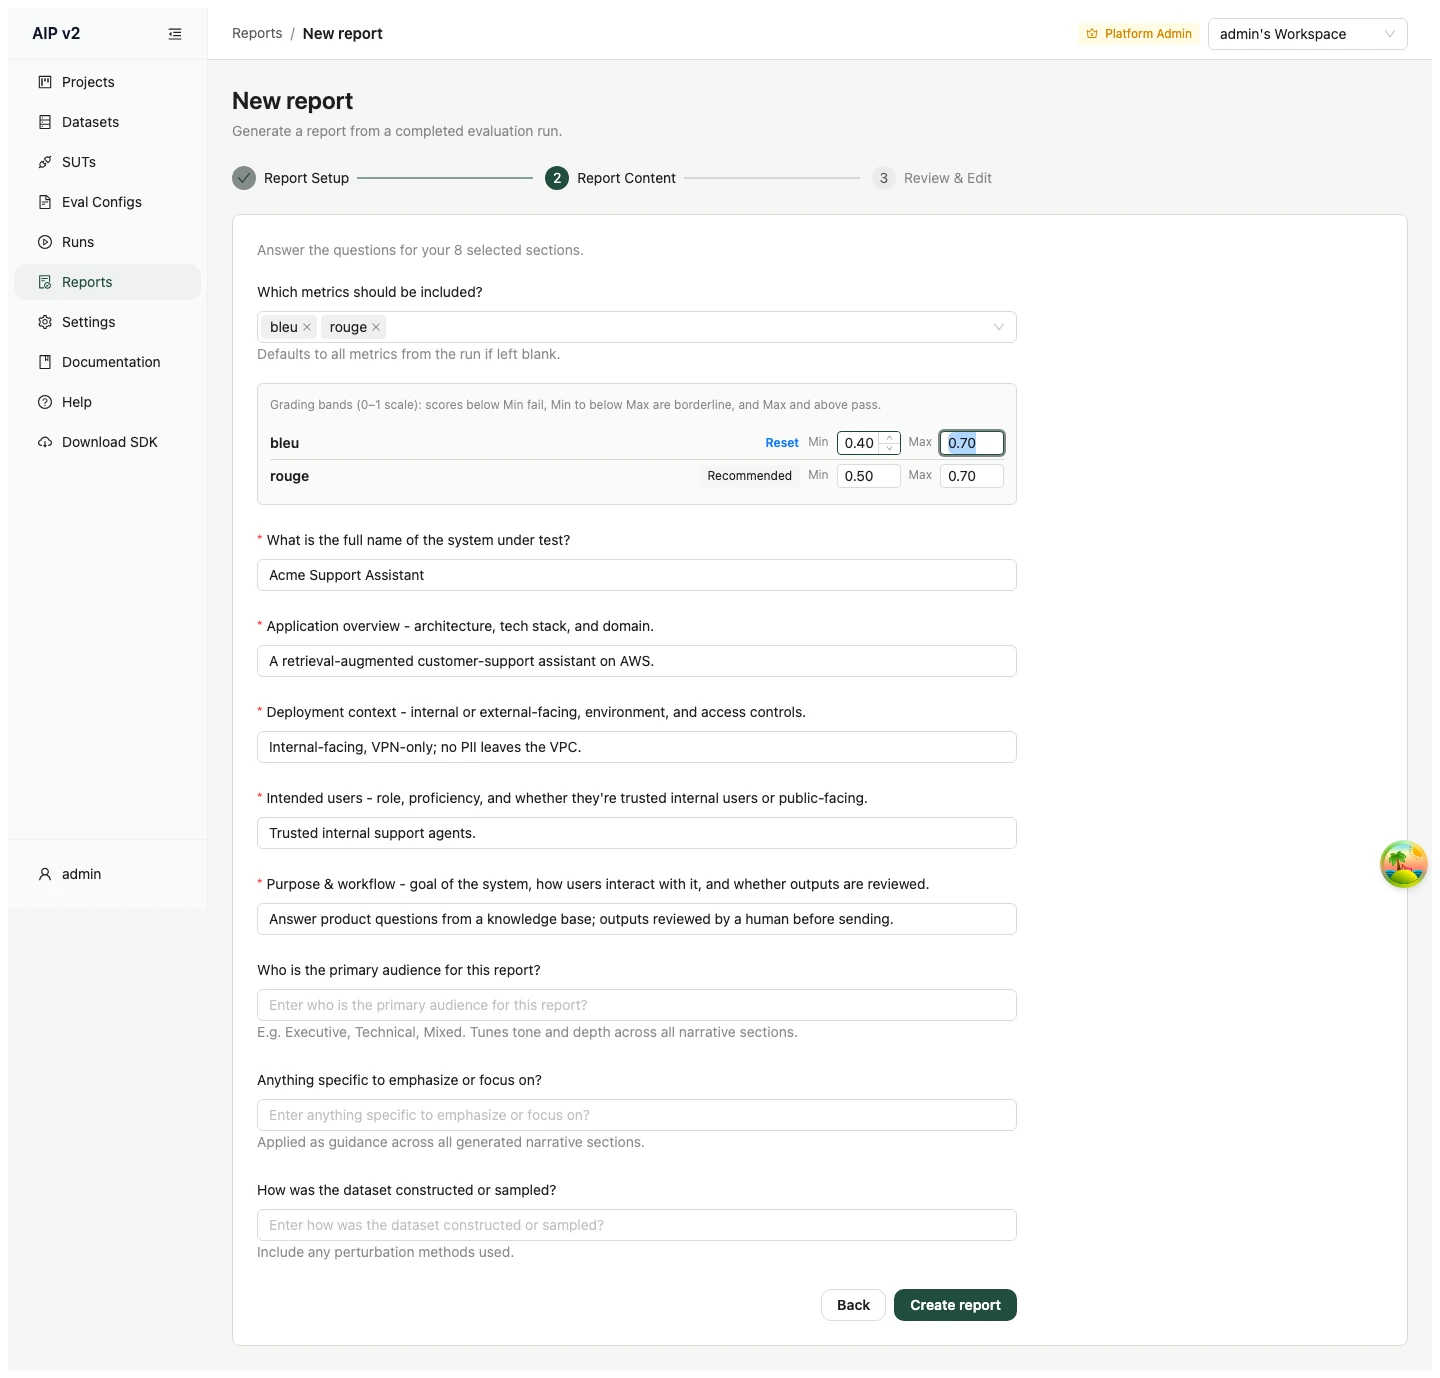
Step 2 — Report Content. A single flat form asks only for what your selected sections need. Required fields are marked * with helper text under each:
- Which metrics should be included? — an optional multi-select; defaults to all of the run's scorer metrics if left blank (disabled with a note when the run exposes none).
- Grading bands (per-metric thresholds) — for each quality metric, a Min / Max pair on the 0–1 scale defines the fail / borderline / pass bands the report grades on. Each metric starts on its Recommended defaults (shown as a tag); edit Min or Max and it flips to a customised band with a Reset link to restore the defaults.
- System description — required free-text covering the system's name, application overview, deployment context, intended users, and purpose & workflow.
- Tone & focus — optional primary audience (tunes tone/depth), anything specific to emphasise, and dataset methodology notes.
Click Create report to queue generation. The report is created and you're taken to Review & Edit (its own /reports/{id}/review URL), which polls while the report generates and then opens the editor automatically. Use Back to revise your run/section choice (your answers are preserved).
📝 Reviewing & Editing a Report
A completed report opens in the on-platform editor — the report rendered exactly as it will export, with your branding, straight in the browser (no PDF plugin). This is also the single source of truth for the preview: what you see here is what the export contains.
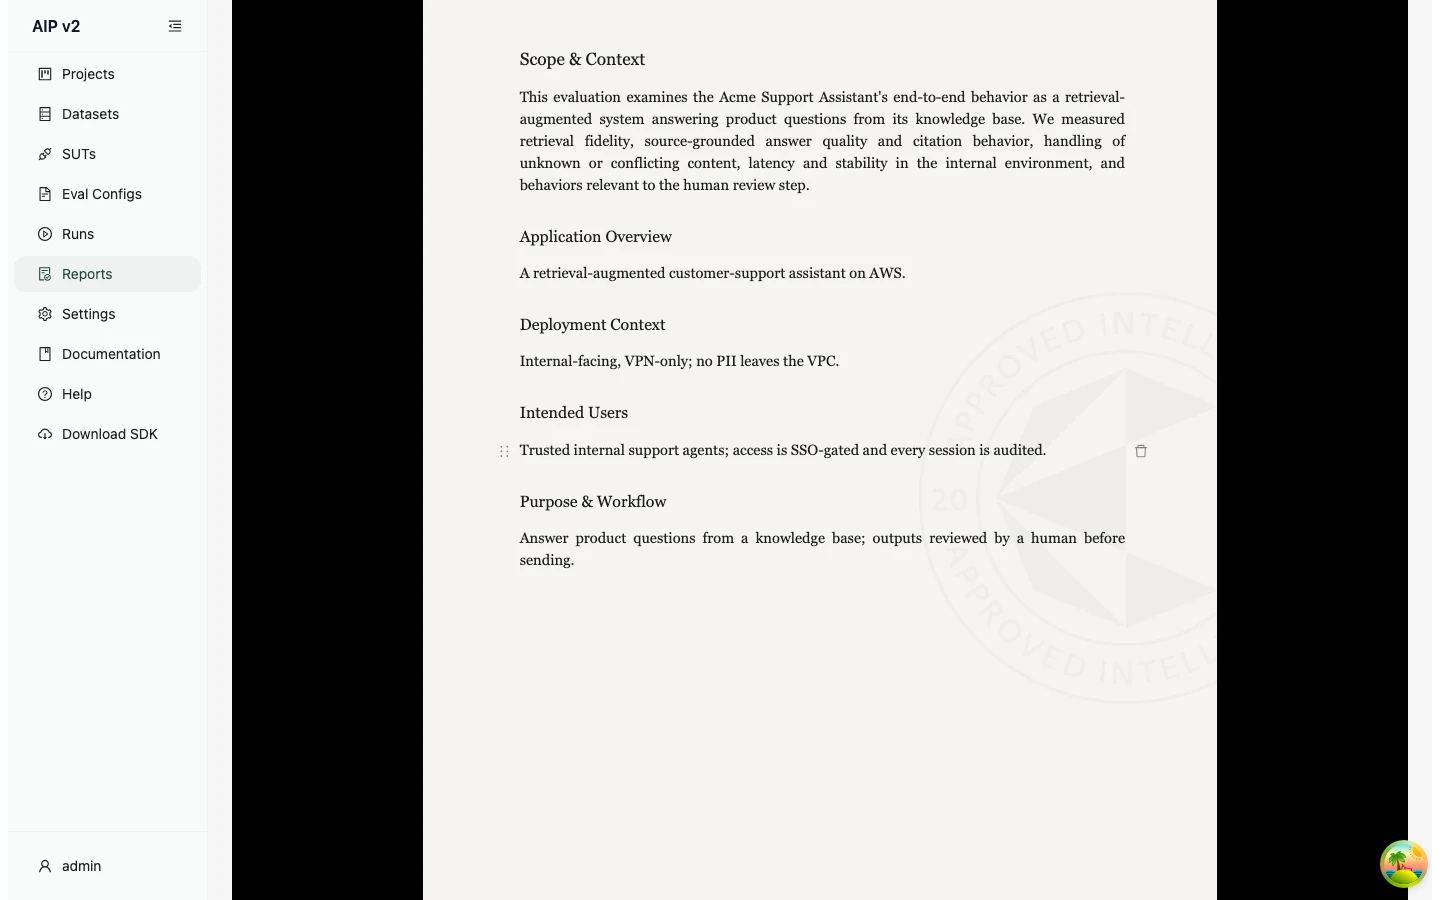
Editing. Narrative prose is directly editable — click into a paragraph and type. Blocks that carry the evaluation result (score tables, charts, example cases) are locked, so edits can never rewrite the numbers. Each editable block has a drag handle and a remove control on hover, so you can also reorder or drop prose blocks. Here the Intended Users paragraph has been edited on-platform:
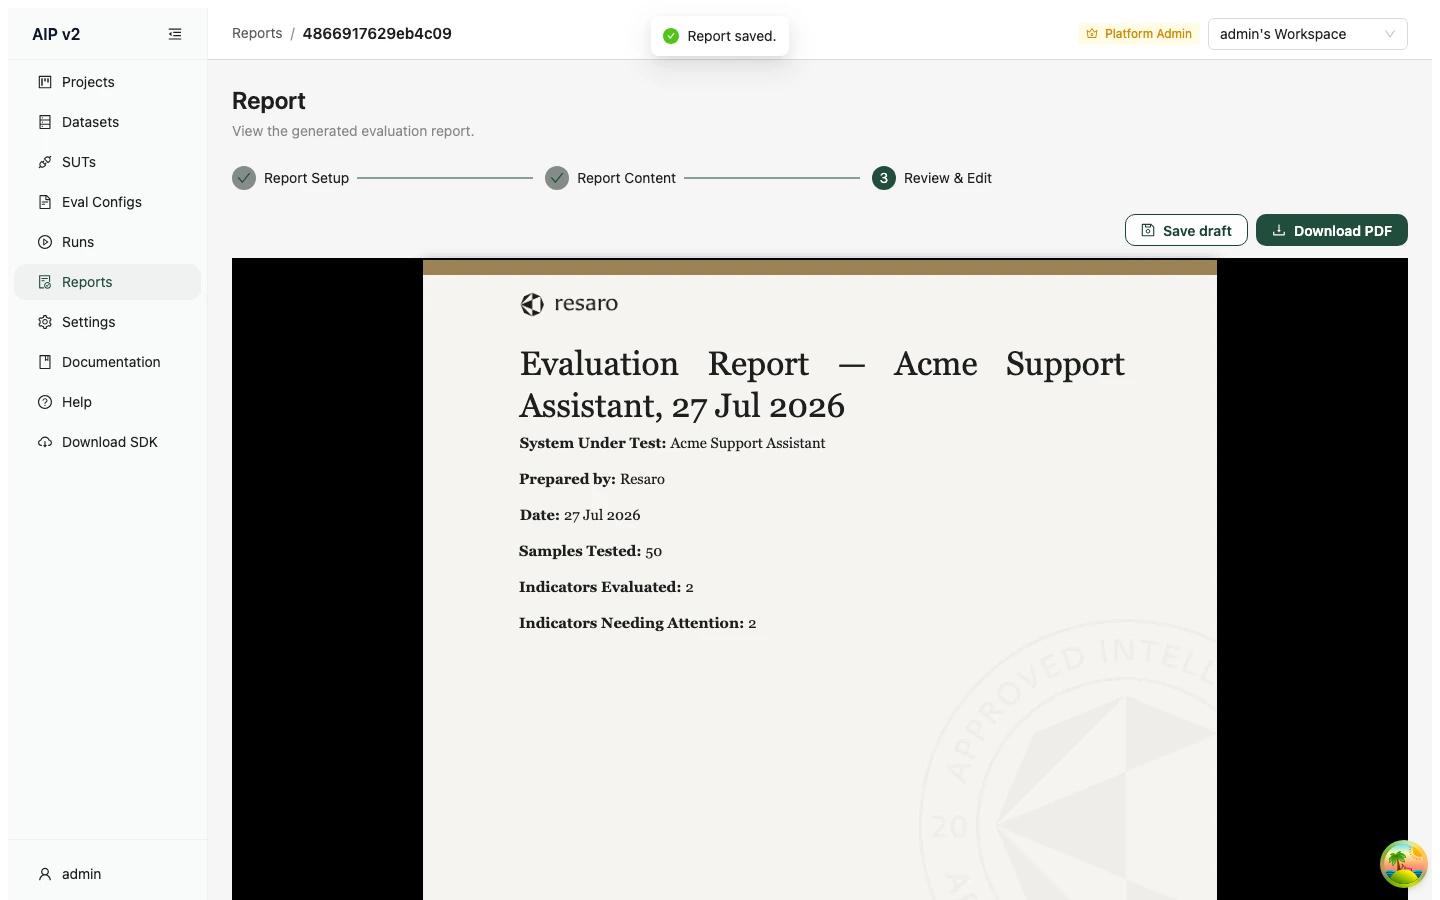
Saving — sticky overrides. Save draft persists your edits as a per-section override layer on top of the AI draft. Overrides are sticky: if the report is regenerated, your edited sections keep your prose while the locked result blocks refresh to the new data. (An edit is stored only for the sections you actually changed; the rest continue to track the AI draft.)
📄 Export & Provenance
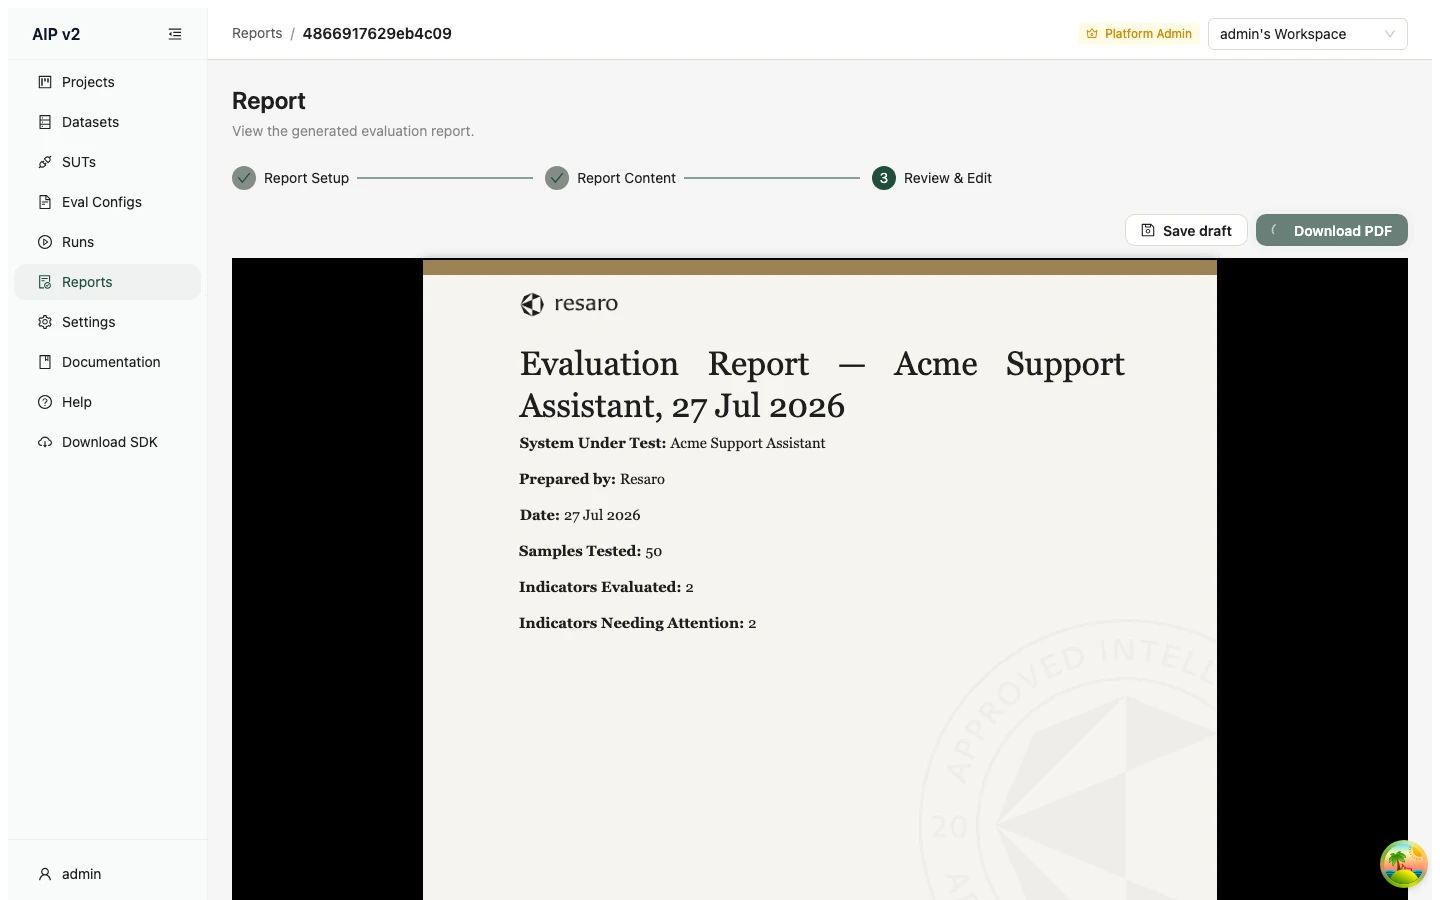
Download PDF exports the report — compositing your edits over the AI draft and rebuilding the branded PDF — then downloads it. The file name is set by the server ({sut}-{report id}-{date}.pdf). Because the export is built from the same content as the on-platform preview, the two always agree: the preview is not a separate approximation of the PDF, it is the same document rendered in the browser.
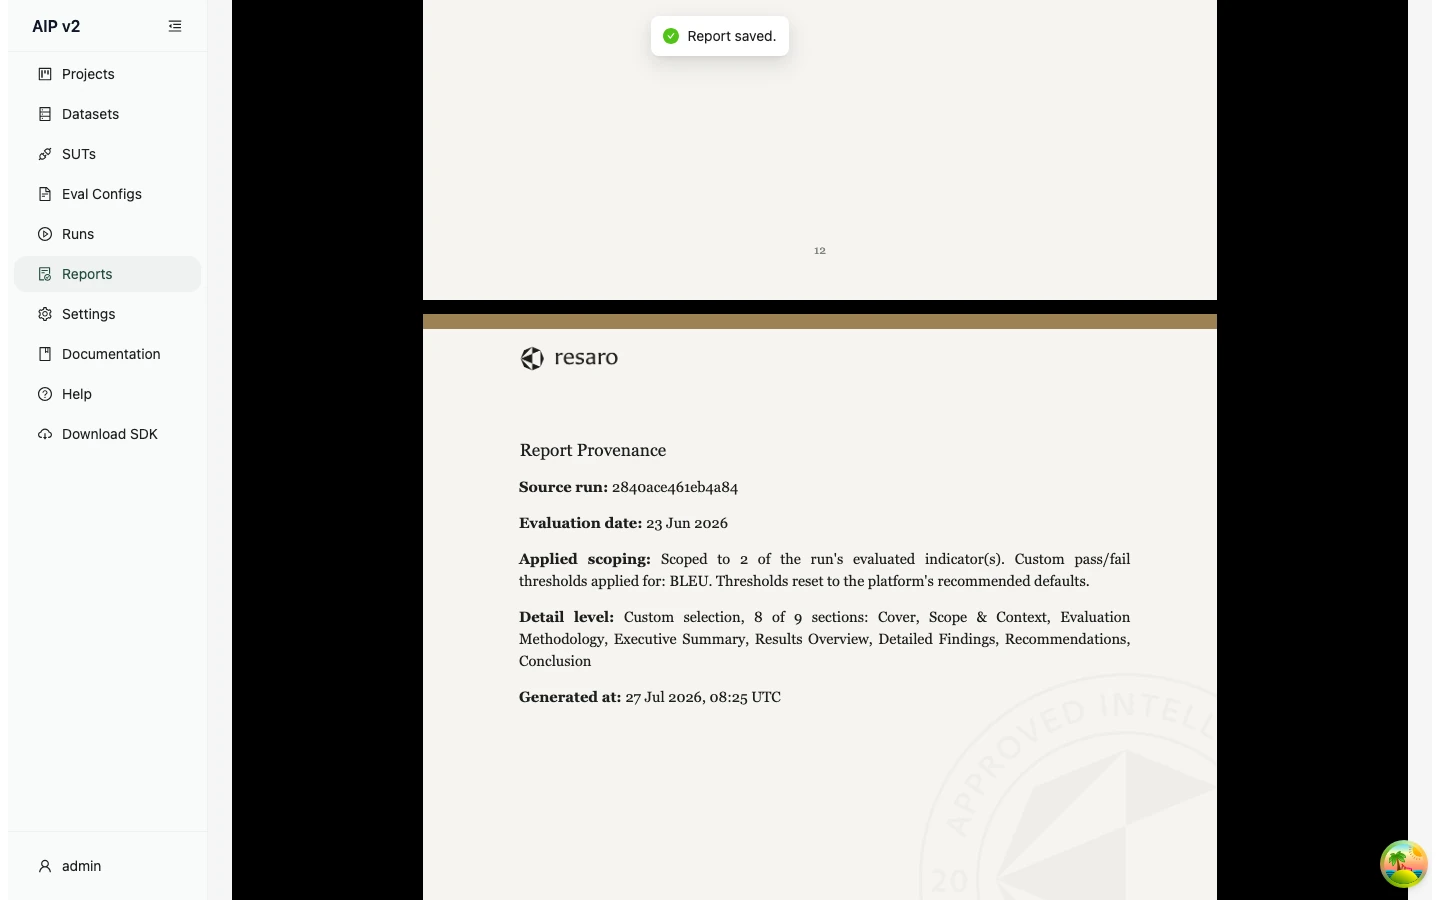
Every export ends with a Report Provenance footer, so the document is self-describing — it always records exactly how it was produced, regardless of which sections you kept:
- Source run — the evaluation run the report was built from.
- Evaluation date — when that run was evaluated.
- Applied scoping — the metric subset and any custom pass/fail thresholds (or a note that thresholds were reset to the platform defaults).
- Detail level — the exact section selection (e.g. "Custom selection, 8 of 9 sections: …" when you deselected any, or "Full report" when you kept them all).
- Generated at — the UTC timestamp of the export.
The Report Builder is UI-only — there is no SDK equivalent for generating reports.