Screen-by-Screen Walkthroughs
Use the console to create a project, prepare a dataset, connect a system, and inspect an evaluation run.
The AIP v2 Web UI is the browser front-end for the Approved Intelligence Platform. It drives the full evaluation workflow — create a project → upload & curate a dataset → register a System Under Test → launch an evaluation run → analyse the results — all the things you can also do through the SDK (see the AIP v2 SDK Reference), but point-and-click.
This guide walks each screen in workflow order. It pairs with the SDK reference: where a UI action has a code equivalent, the section ends with an SDK equivalent note.
🚀 Before you start
- Open the console URL supplied by your administrator. The sign-in, projects, project datasets, project runs, reports and test-plan screenshots use a synthetic demonstration workspace captured from the current console. Other screens retain the migrated walkthrough images.
- You need an account — the app is gated behind a login (see Signing In below).
- Everything is scoped to a workspace, so make sure one is selected (see Getting around).
🧭 Getting around
- Left sidebar — the primary navigation: Projects, Datasets, SUTs, Eval Configs, Runs, Reports, and Settings.
- Workspace selector — projects, datasets, SUTs, and configs all belong to the active workspace; switch workspaces with the selector in the top bar. If you belong to no workspace, you'll see a "No workspace access" prompt to contact an administrator.
- Breadcrumbs at the top of each page show where you are and let you jump back up.
- The user menu (top-right) shows your username and a Logout action.
📑 On this page
- 🔐 Signing In
- 📁 Projects
- 🗂️ Datasets
- ✅ Dataset Quality & Promoting to Golden
- 🔌 SUTs (Systems Under Test)
- 📋 Test Plans
- 🧩 Eval Configs
- ▶️ Launching an Evaluation Run
- 🏃 Runs — List & Detail
- Comparing Two Runs
- Exporting a Comparison as CSV
- Inspecting Failure Clusters
- 📝 Report Builder
- ⚙️ Settings
🔐 Signing In
The AIP v2 UI is gated behind a login screen — if you are not authenticated, you are redirected to /login.
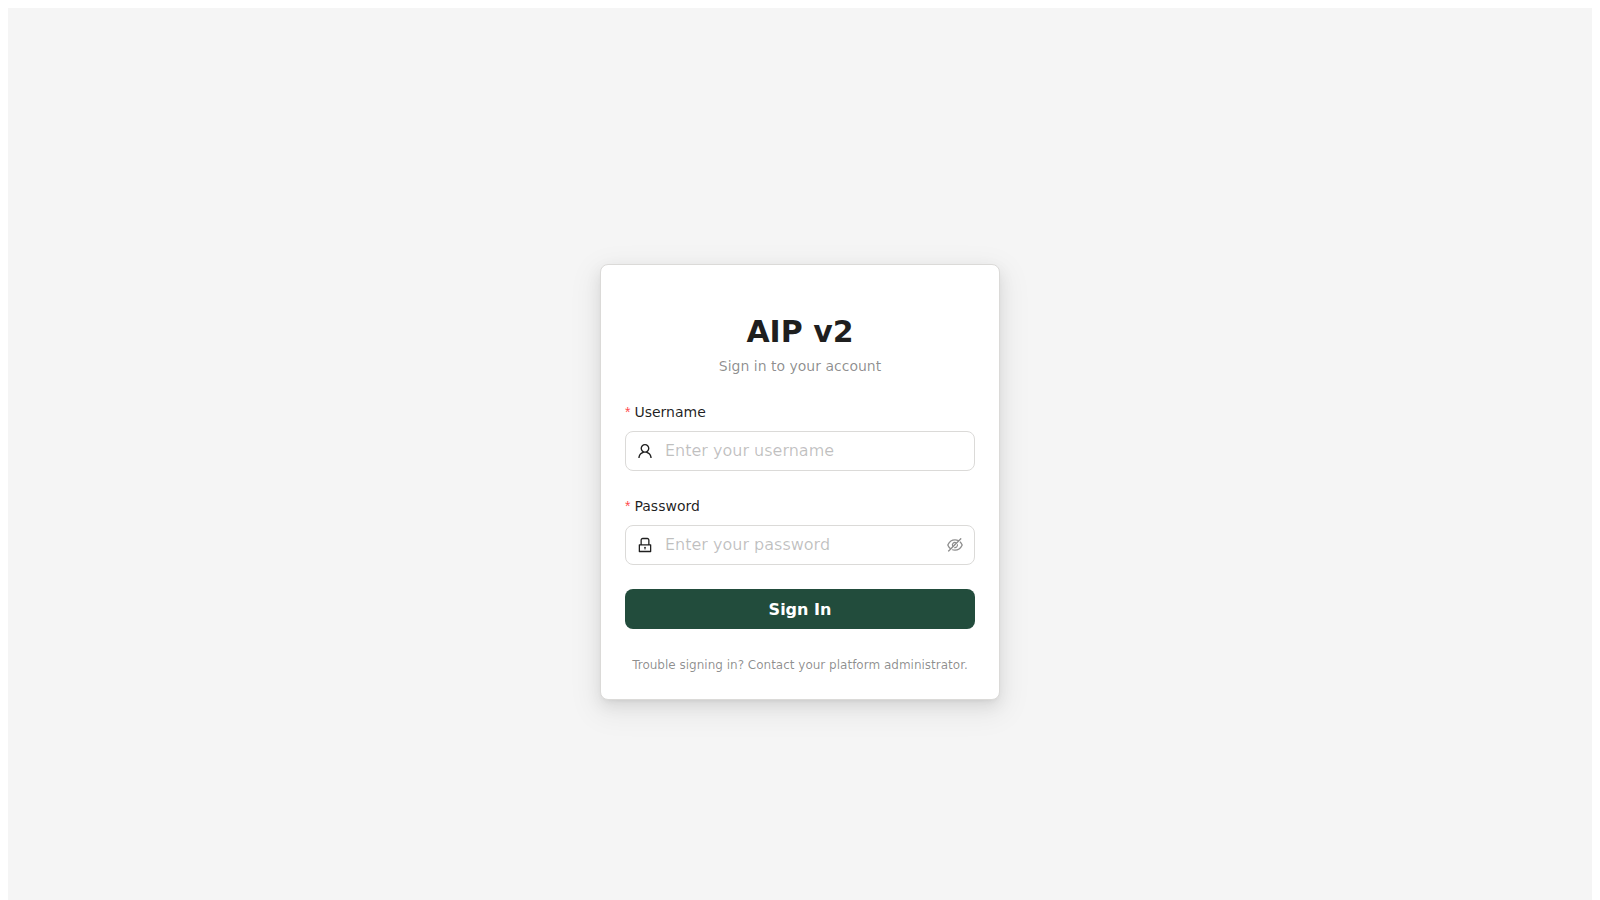
- Enter your Username and Password and click Sign In (the button shows Signing in… while it works).
- On success you are taken to the Projects page (
/projects) — or back to whatever page you were trying to reach before being redirected. - Bad credentials surface an inline red alert — "Login failed. Please check your credentials." (or the server's specific reason).
- Lost your password? The footer says it all: "Trouble signing in? Contact your platform administrator."
Sessions persist across reloads, so you normally sign in once per browser.
📁 Projects
A project binds a GDI schema (and, for images, a task type) to a set of evaluation dimensions, and owns the datasets, SUTs, eval configs, and runs created under it.
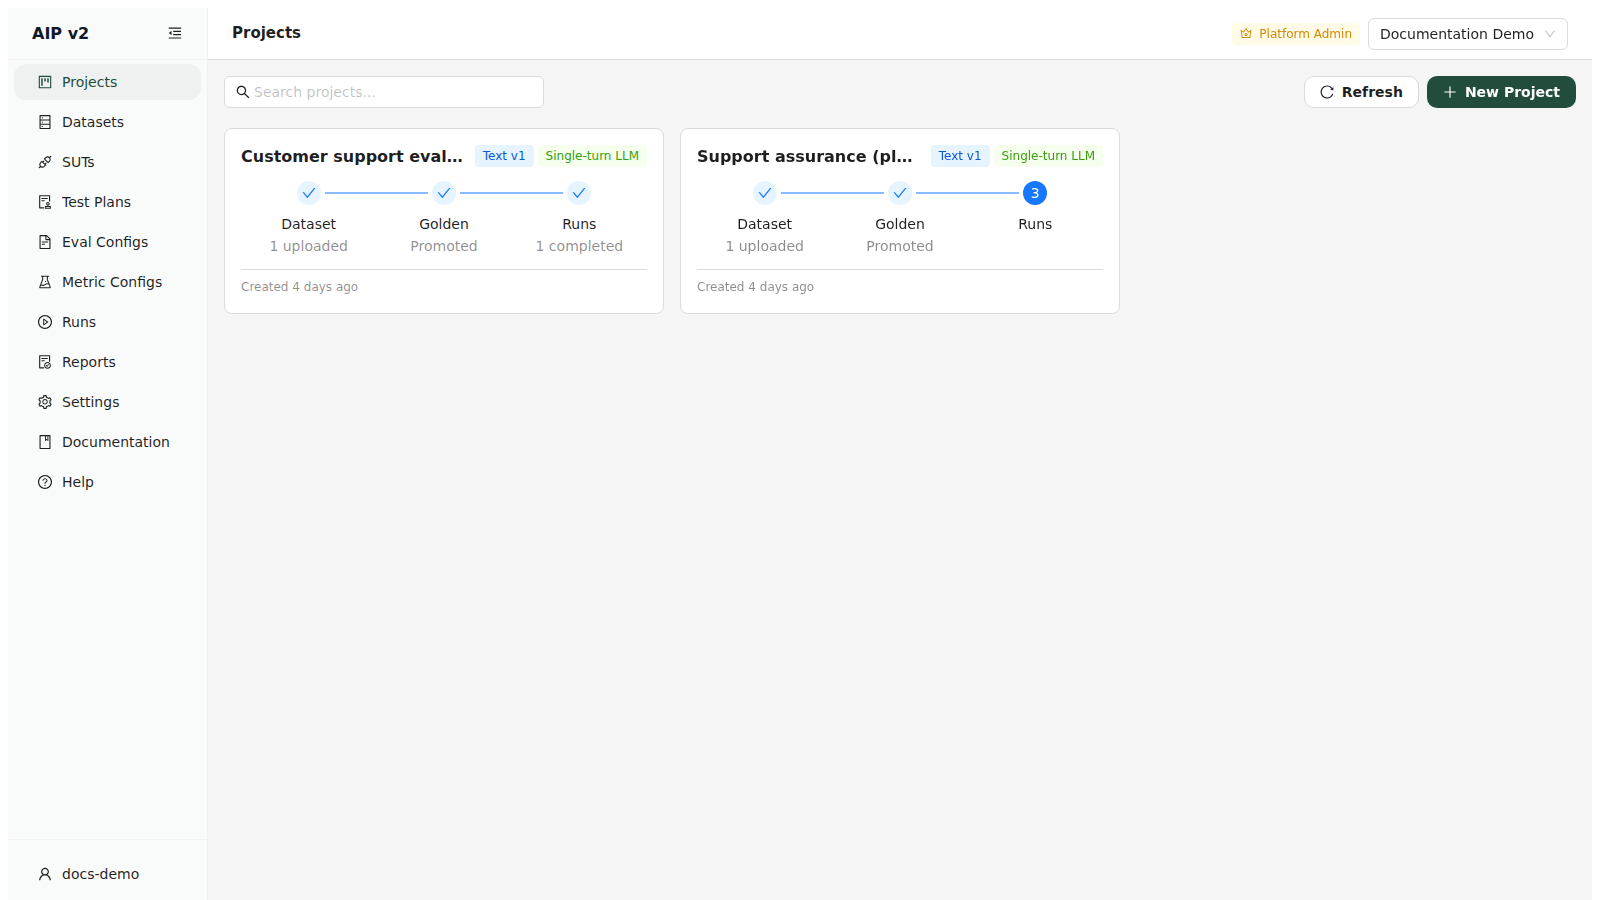
➡️ The Projects List
Open /projects. Each project is a card, newest first. Use the Search projects… box to filter by name, Refresh to re-fetch, and New Project (top-right) to open the creation wizard.
✳️ Creating a Project — the 3-Step Wizard
New Project opens a 3-step modal: Setup → Dimensions → Review.
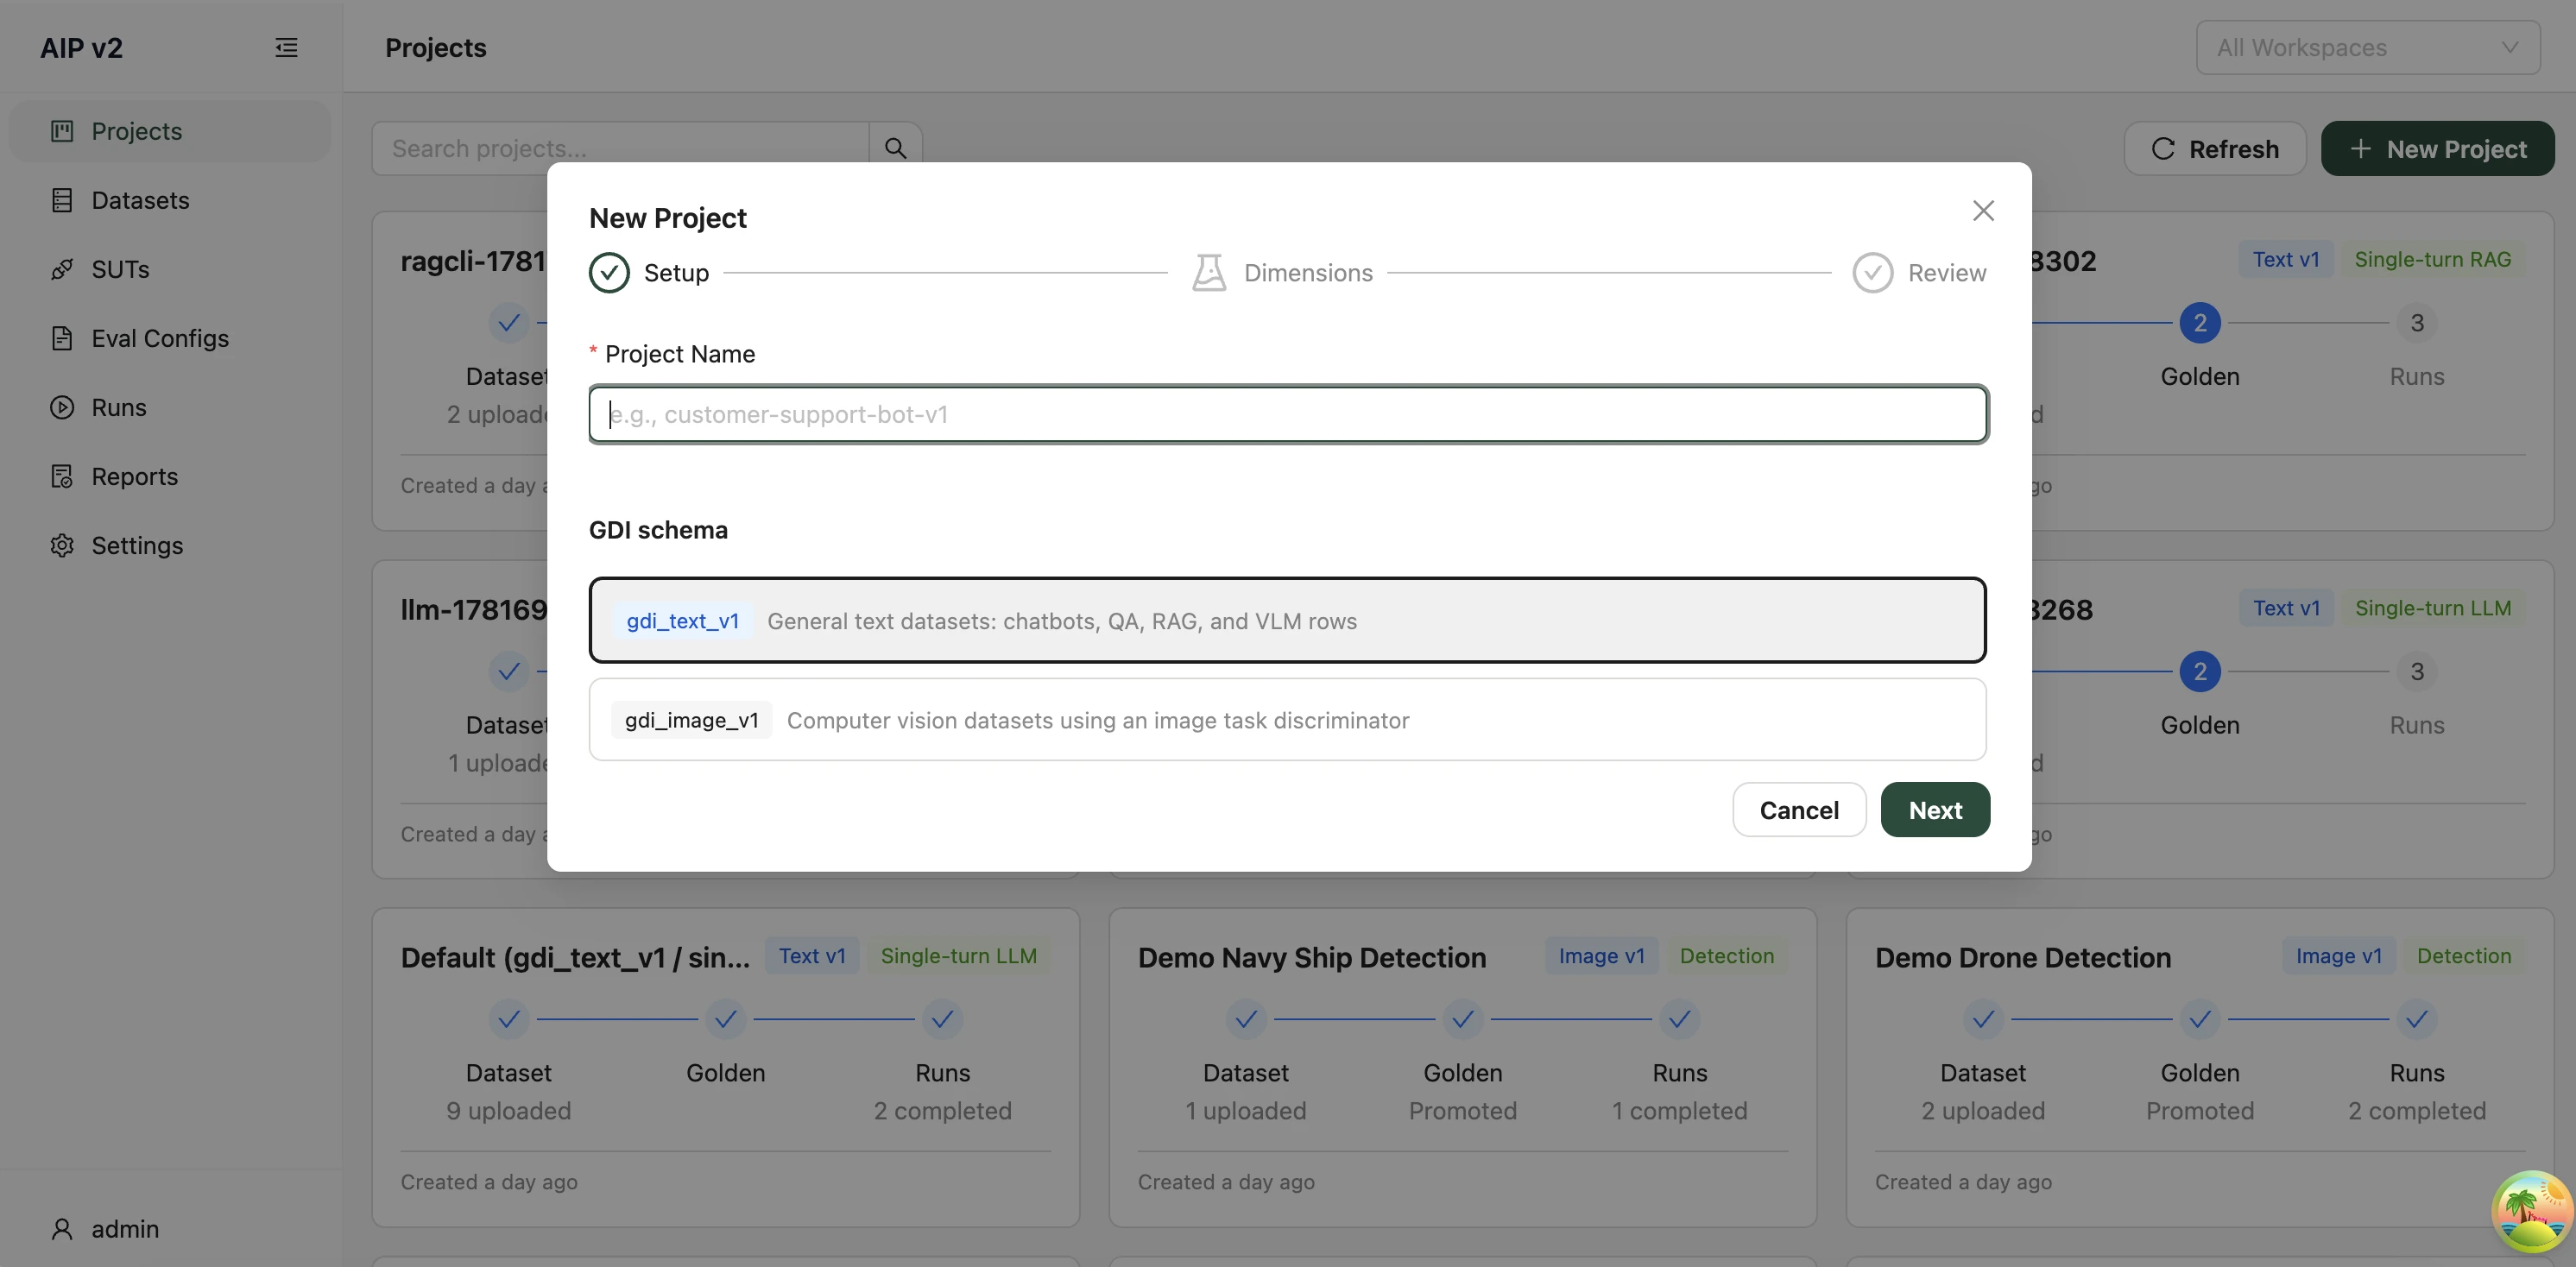
Step 1 — Setup. Give the project a name (letters, numbers, hyphens, and underscores only) and pick a GDI schema:
| Schema | Use for |
|---|---|
gdi_text_v1 | General text datasets: chatbots, QA, RAG, and VLM rows |
gdi_image_v1 | Computer vision datasets — also pick an image task type (classification / detection / segmentation / instance) |
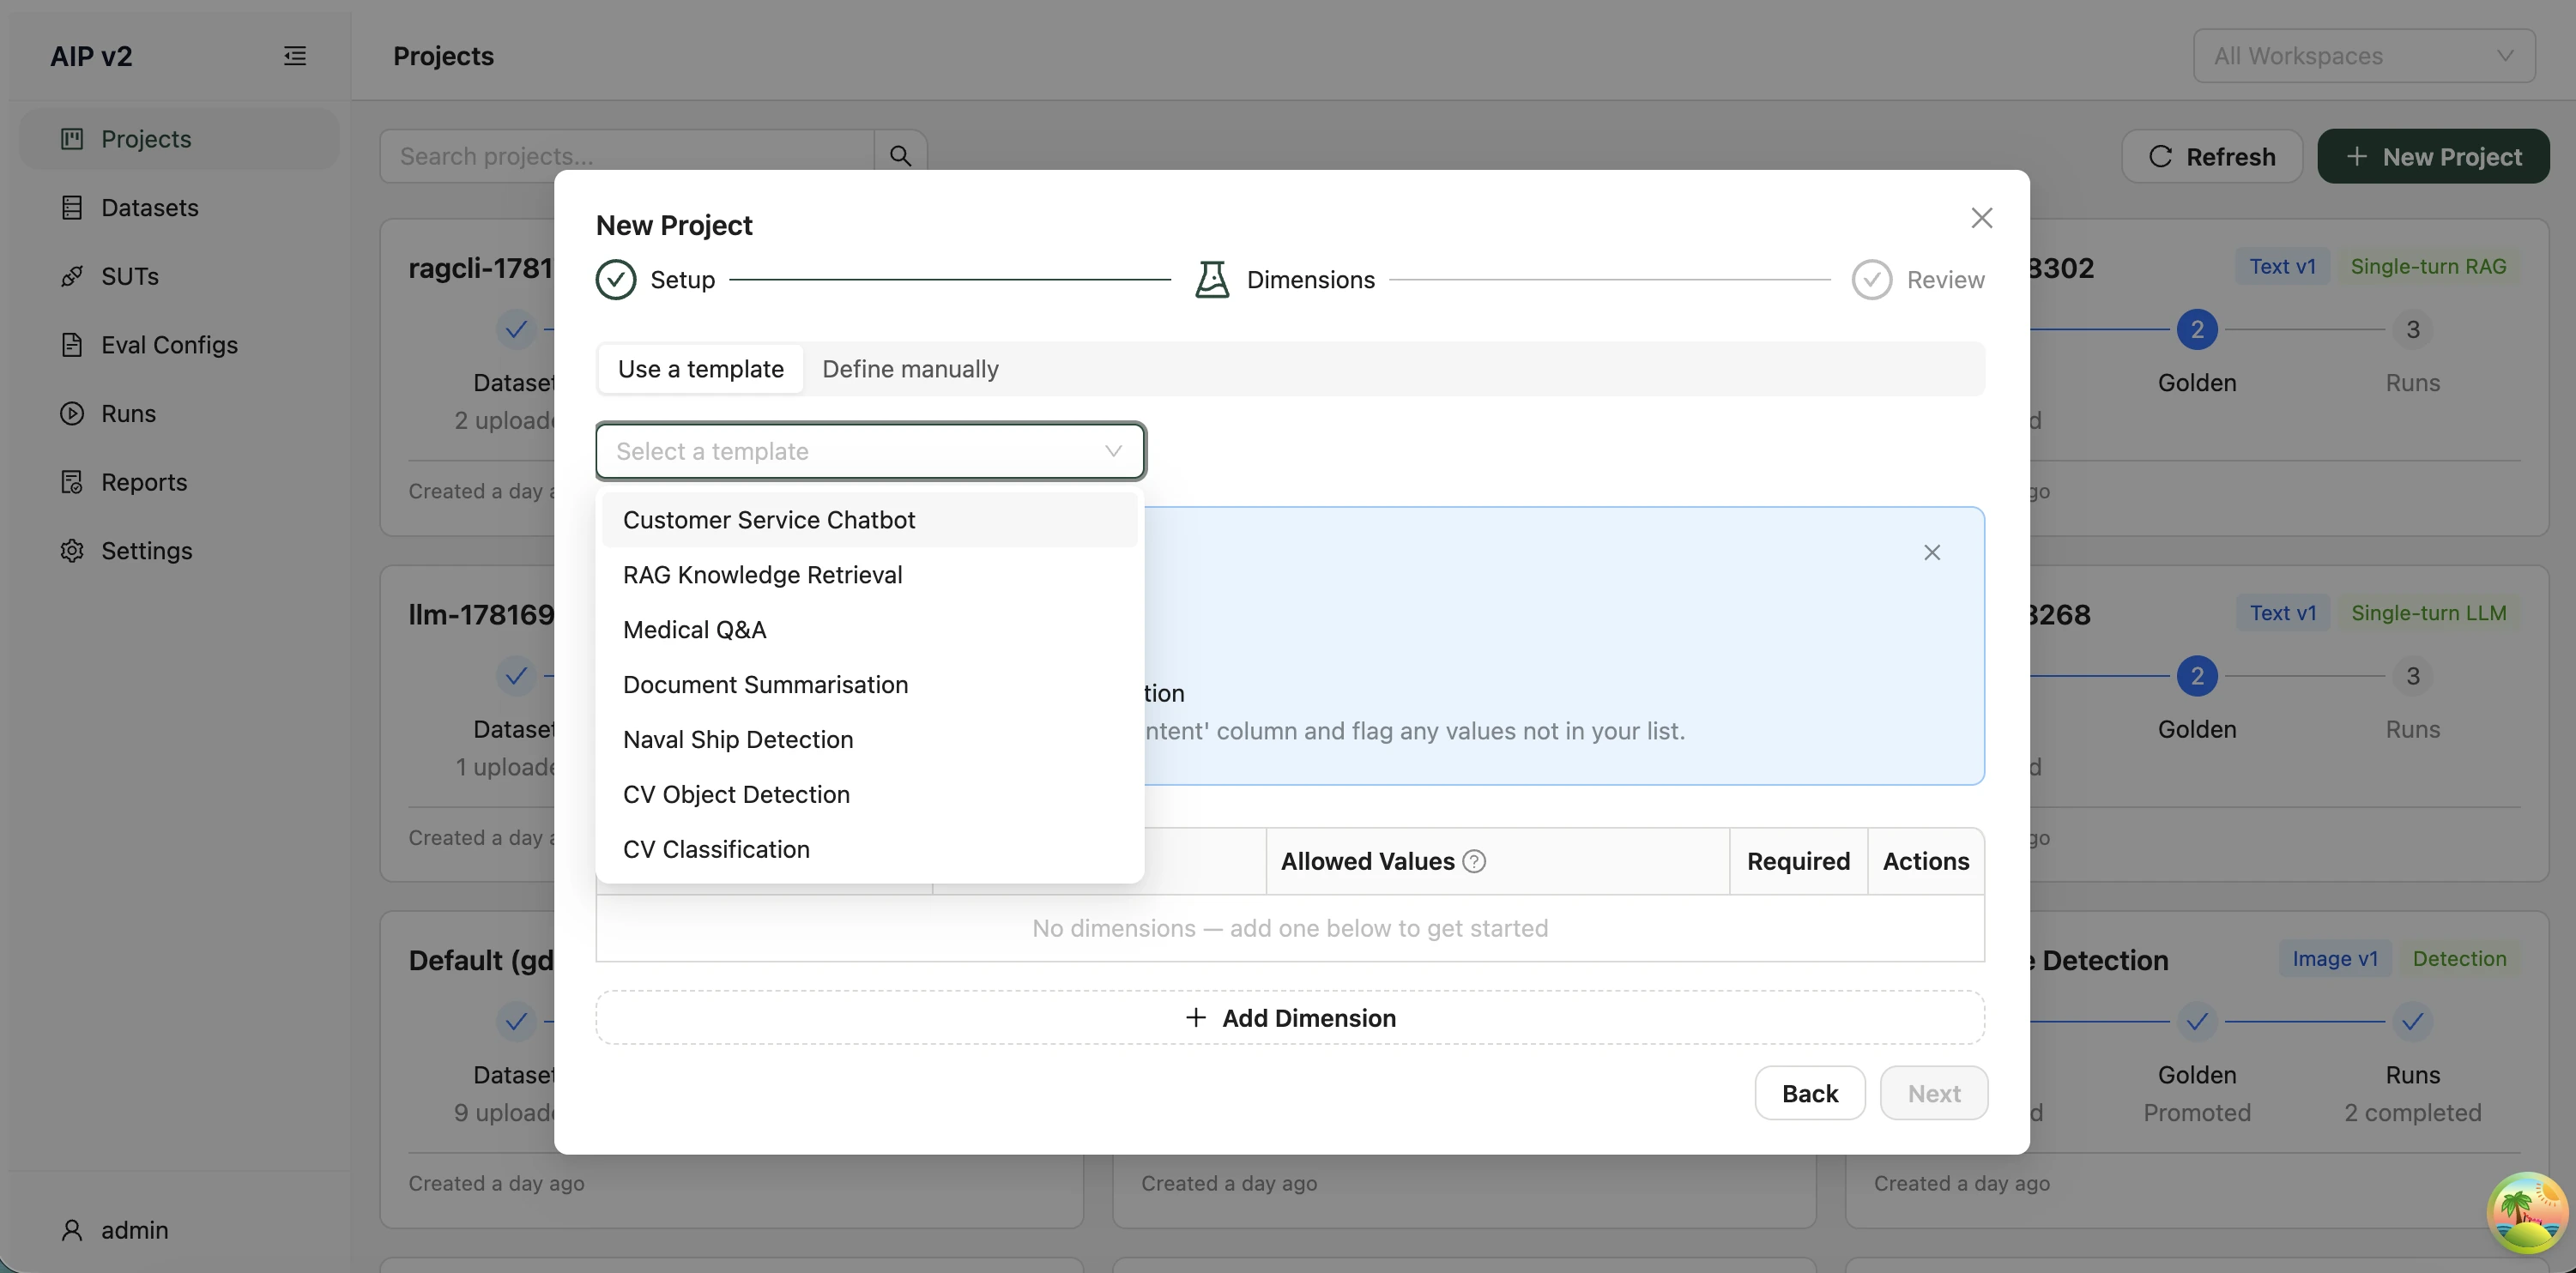
Step 2 — Dimensions. Dimensions are the categorical axes (e.g. intent, difficulty) used for coverage and grouped analysis. Choose Use a template to seed them from a built-in template, or Define manually to add rows yourself. You must declare at least one dimension before Next is enabled.
Step 3 — Review. Confirm the name, schema/task tags, and dimension list, then click Create Project.
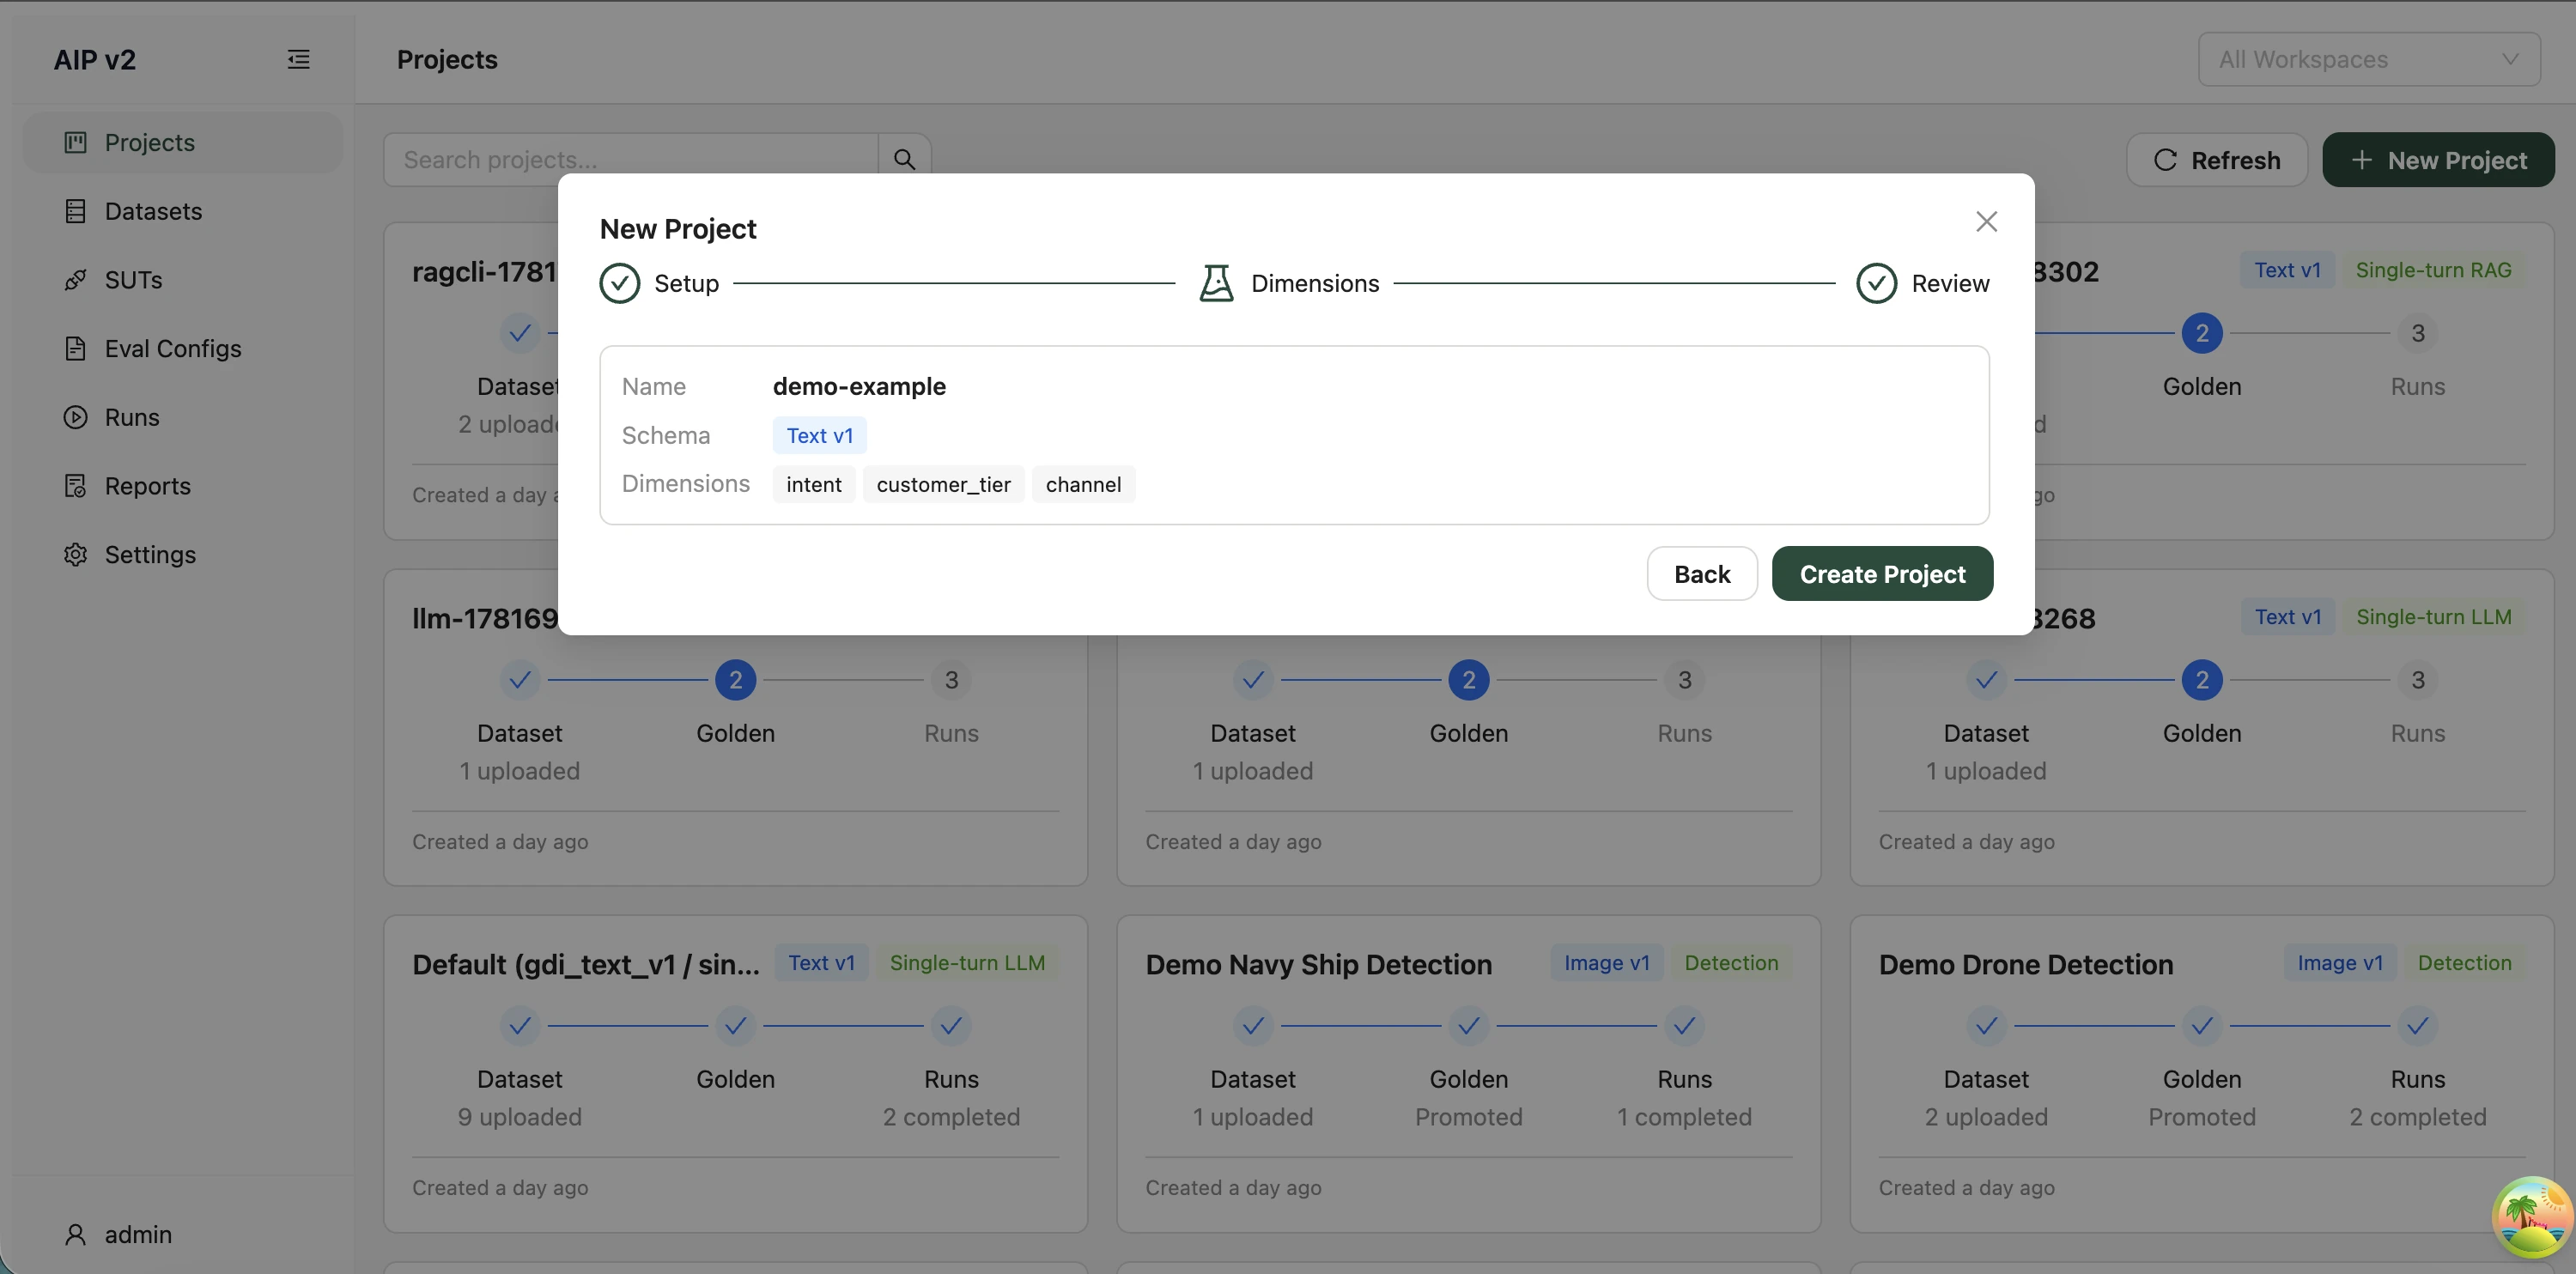
📋 The Project Detail Page
Clicking a project card opens its detail page. A summary header shows the schema, task type, whether an evaluation (golden) dataset is promoted, the SUT and run counts, when it was created, and the dimensions (hover a dimension tag to see its vocabulary), plus a Move to workspace… action for relocating the project to another workspace.
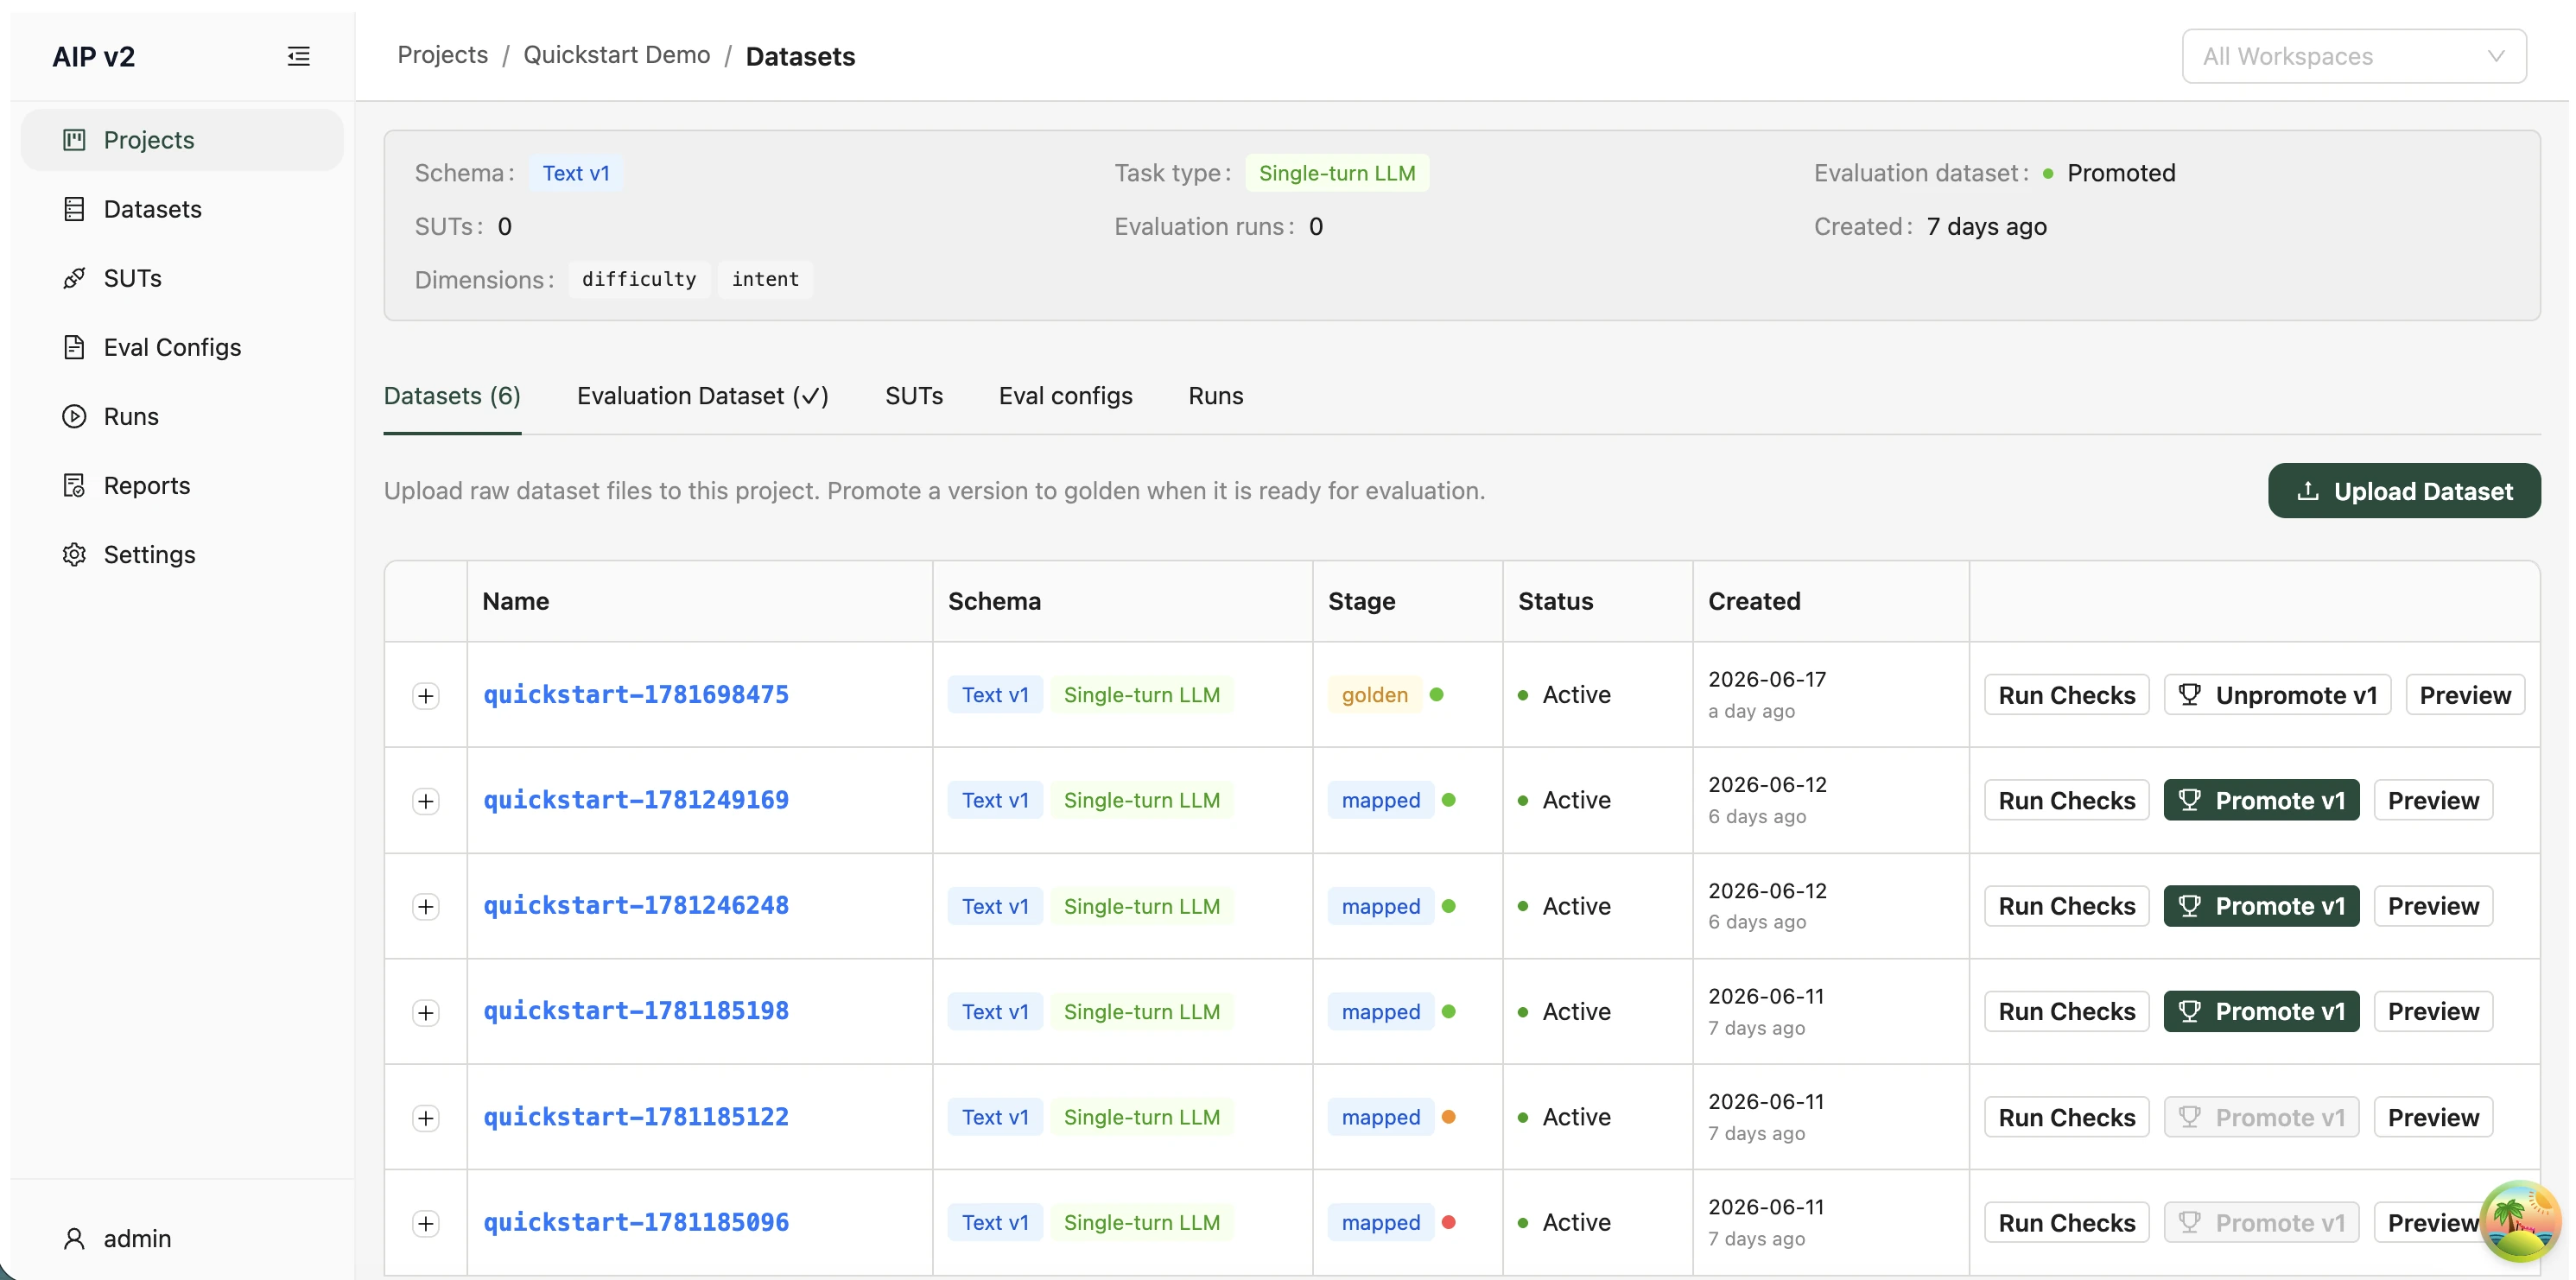
Below the header are five tabs — each is the project-scoped view of a top-level area:
| Tab | What it shows |
|---|---|
| Datasets | Datasets linked to this project, with an expandable per-version timeline (stage + quality verdict). Upload and promote from here. (See the Datasets section.) |
| Evaluation Dataset | The golden version, its coverage health, and the promote / run-checks workflow. |
| SUTs | Systems Under Test registered to this project. (See the SUTs section.) |
| Eval configs | Eval configs whose project field matches this project. (See the Eval Configs section.) |
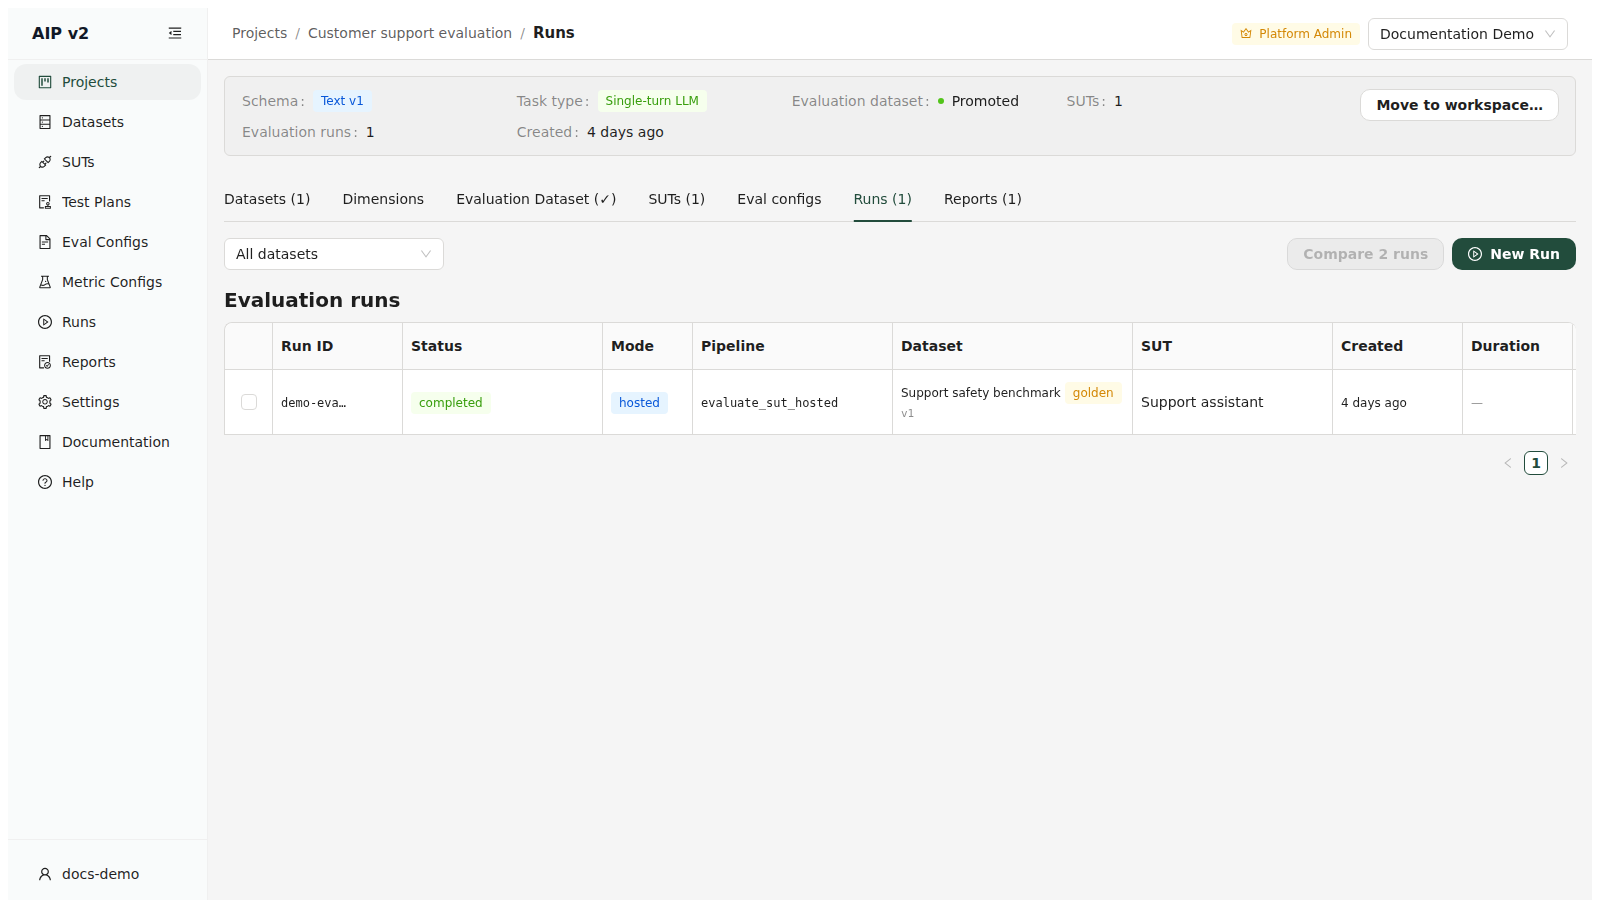
| Runs | Evaluation runs for this project; select exactly two completed runs to compare side-by-side. |
📤 Moving a Project to Another Workspace
Move to workspace… in the summary header reparents the project — and everything under it (datasets, runs, eval configs) — into another workspace in one step, with no re-upload. This is how an experiment that started in a personal workspace gets promoted into a shared team workspace once it's worth keeping.
The target picker lists only shared workspaces you can edit (workspace_admin/workspace_editor), excluding the project's current workspace and any personal workspace. A platform admin additionally sees every other workspace under a separate Other workspaces (platform admin) group. Confirming shows a summary of what's about to move, then completes with a success toast — the project disappears from the source workspace's list and appears in the target's.
A System Under Test scoped only to this project moves with it; a SUT shared at the workspace level is copied into the target instead (or reused if an identical one already exists there), so other projects still using it in the source workspace are unaffected.
✅ The Evaluation Dataset Tab (Coverage)
The Evaluation Dataset tab is where you confirm a dataset is fit for evaluation. The Evaluation Dataset Overview card reports the golden version, row count, dimension count, and full coverage as a healthy/total ratio (green when all dimensions are fully covered, amber otherwise), alongside the column mapping applied during promotion.
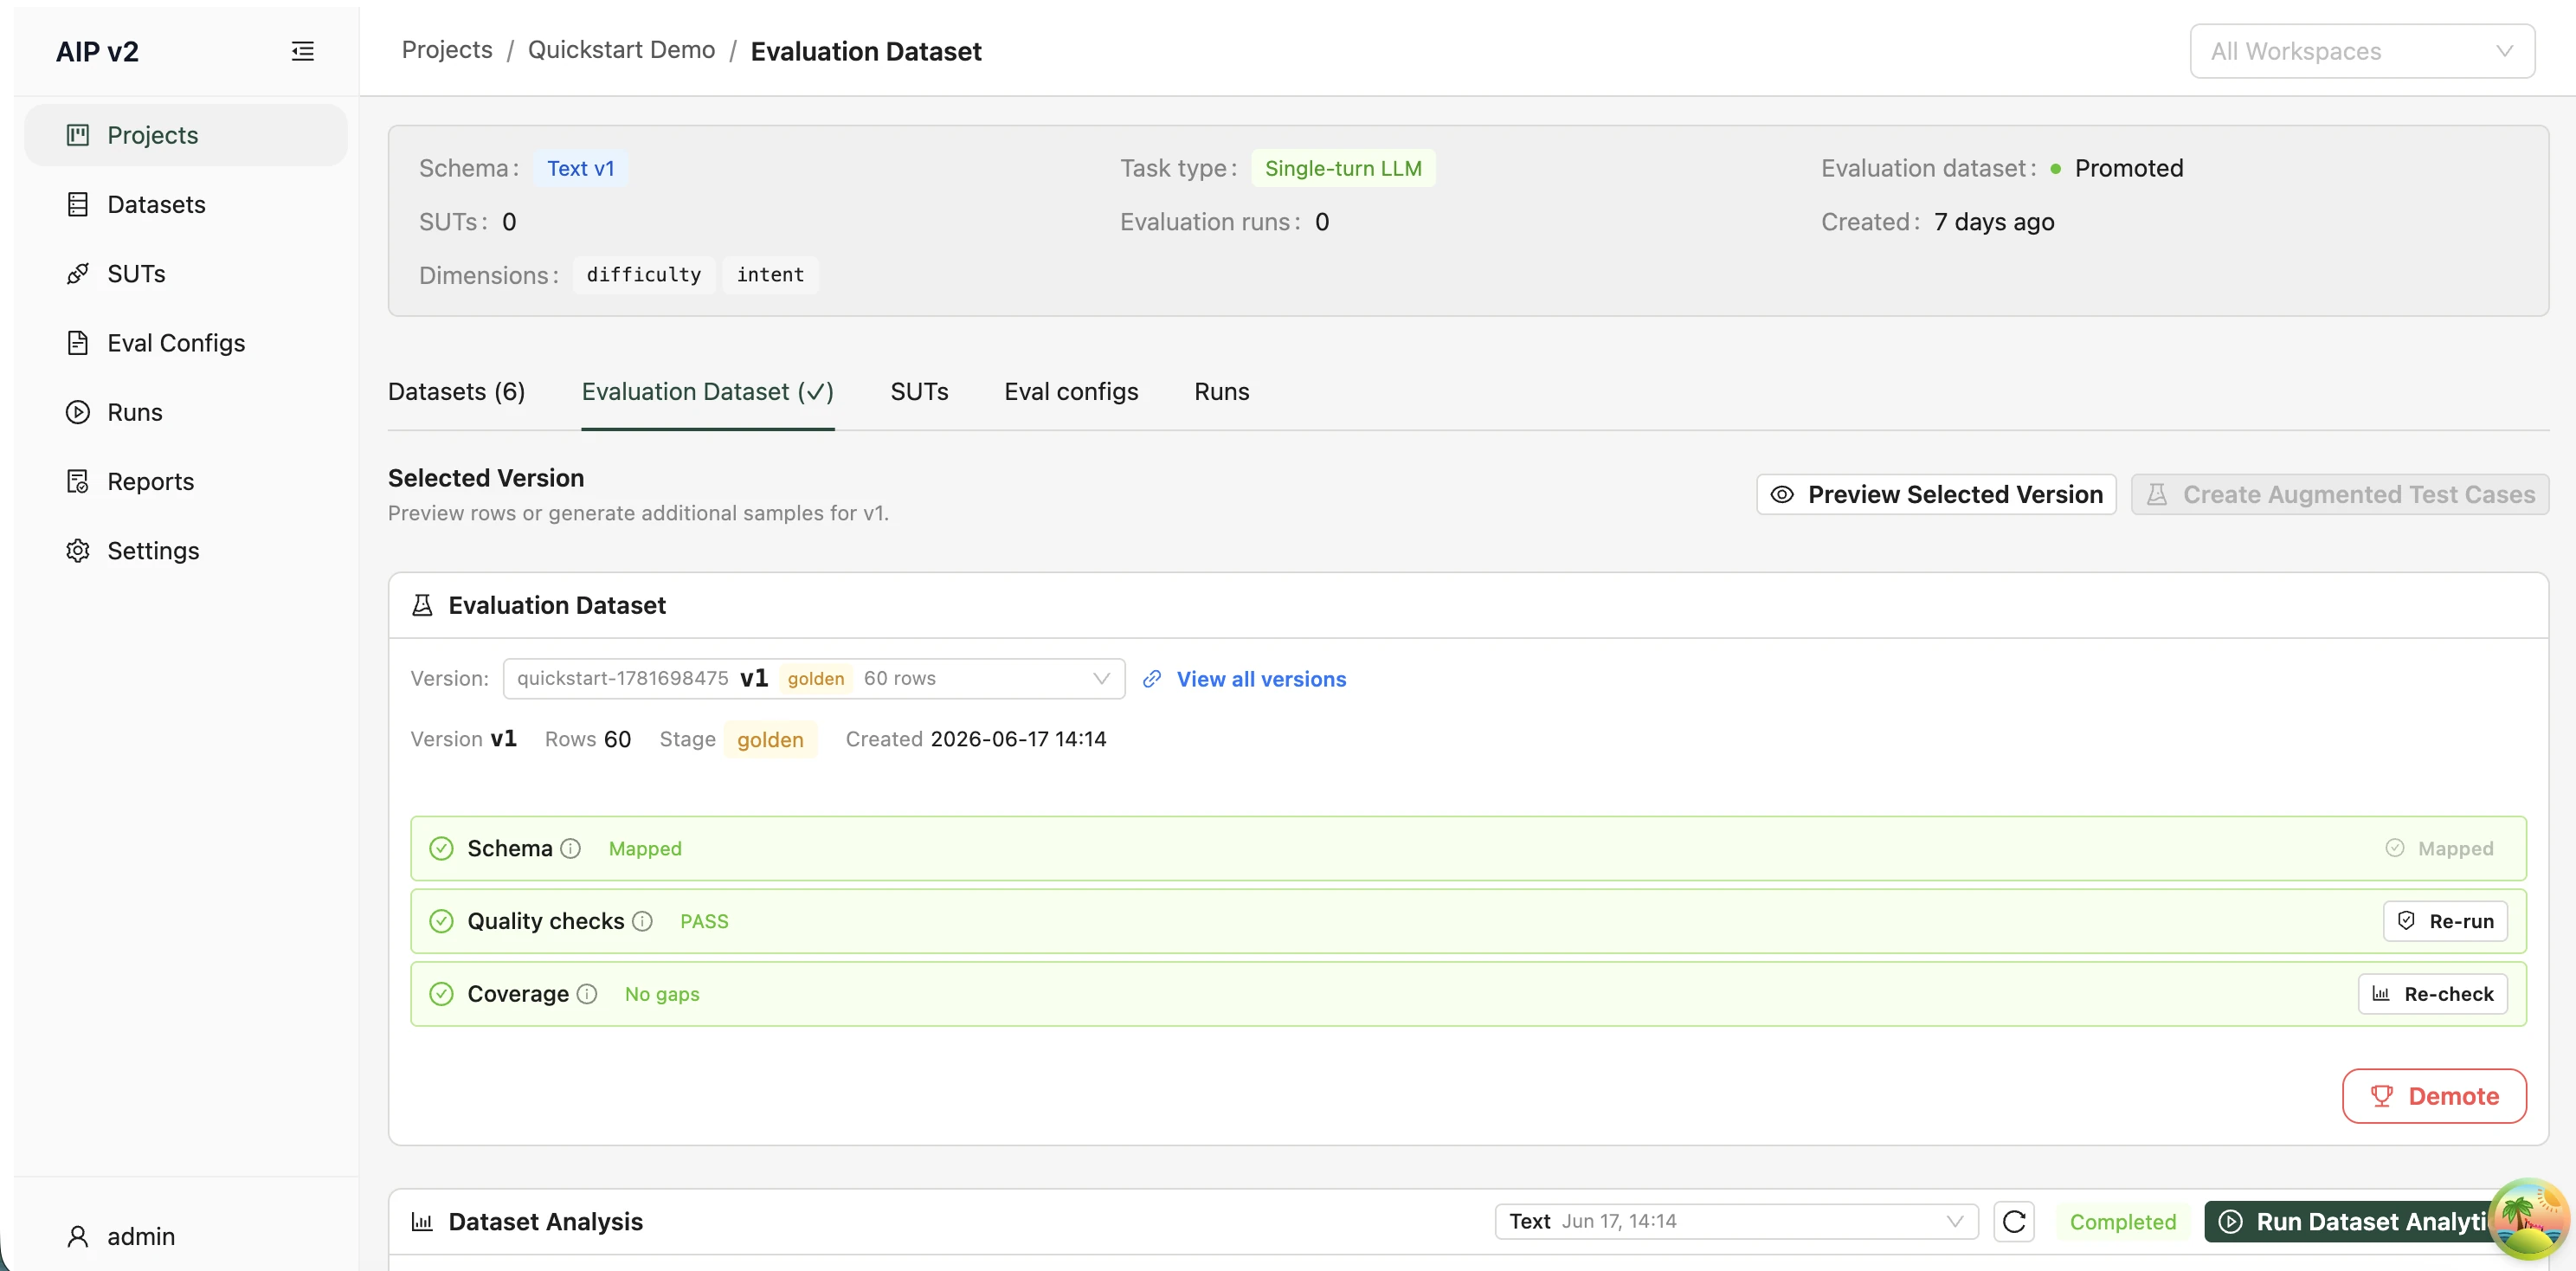
Below it, the per-dimension coverage panel breaks down each dimension's value counts and flags any missing vocabulary values, and the quality panel shows the latest verdict. A version can only be promoted to golden once its quality verdict is PASS.
🗂️ Datasets
The project Datasets tab lists the evaluation data in the selected project.
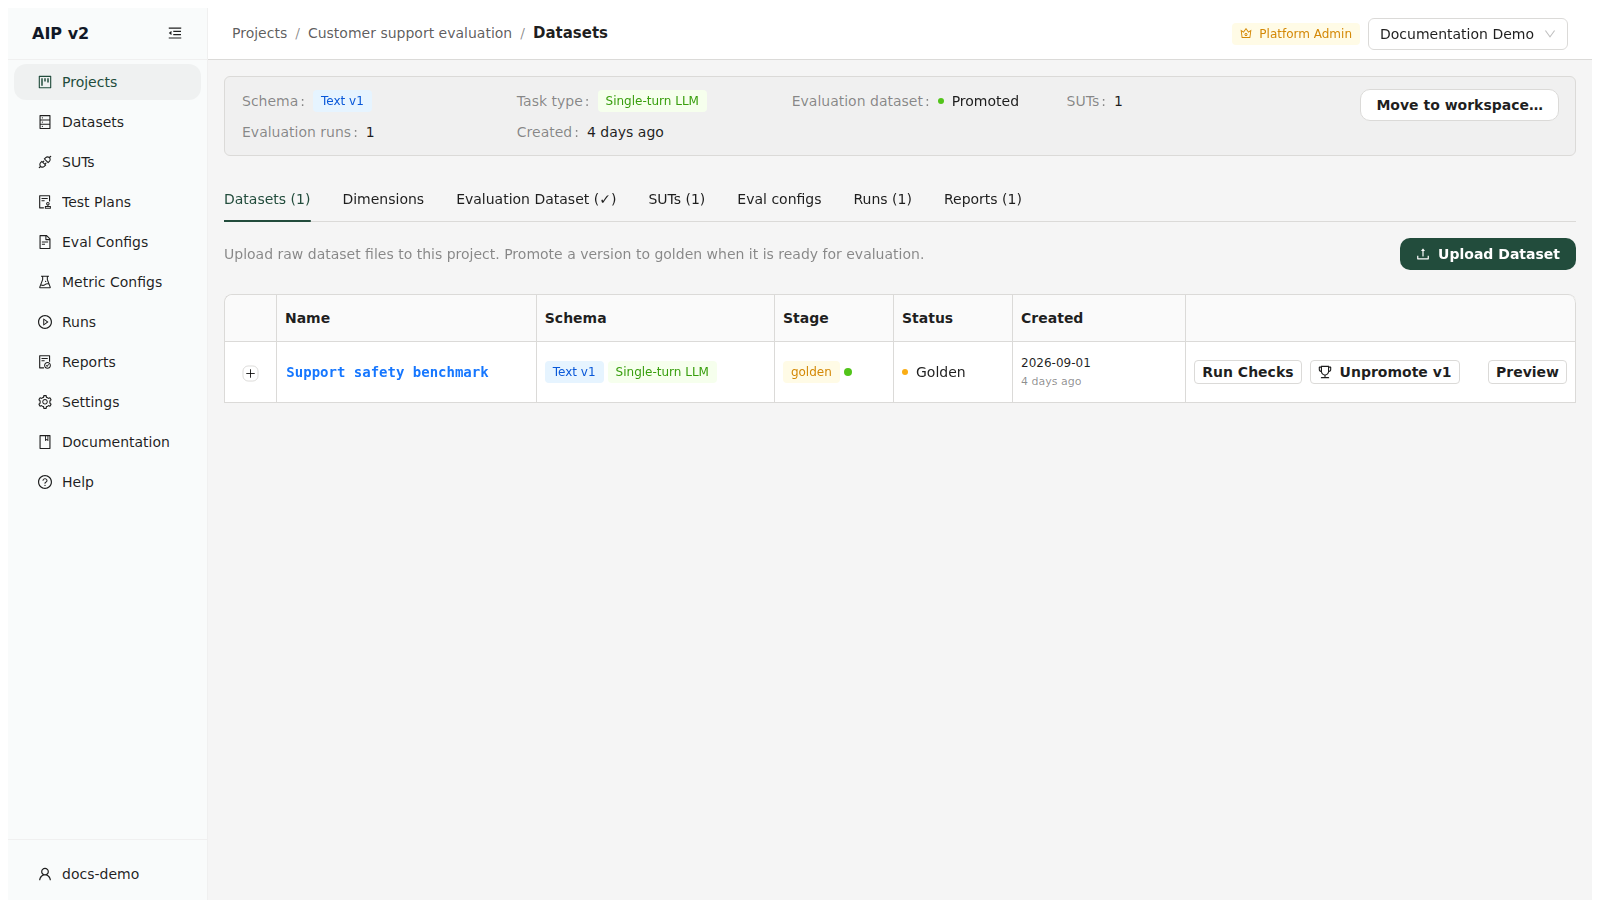
A dataset is a versioned table validated against a GDI schema. Versions move through a lifecycle — raw → mapped → golden — and only a golden version can be used for evaluation.
➡️ The Datasets List
Open /datasets. Every dataset is a card, newest first, showing its schema, status, and lifecycle stage. Search datasets… filters by name, Refresh re-fetches, and Upload Dataset (top-right) opens the upload form.
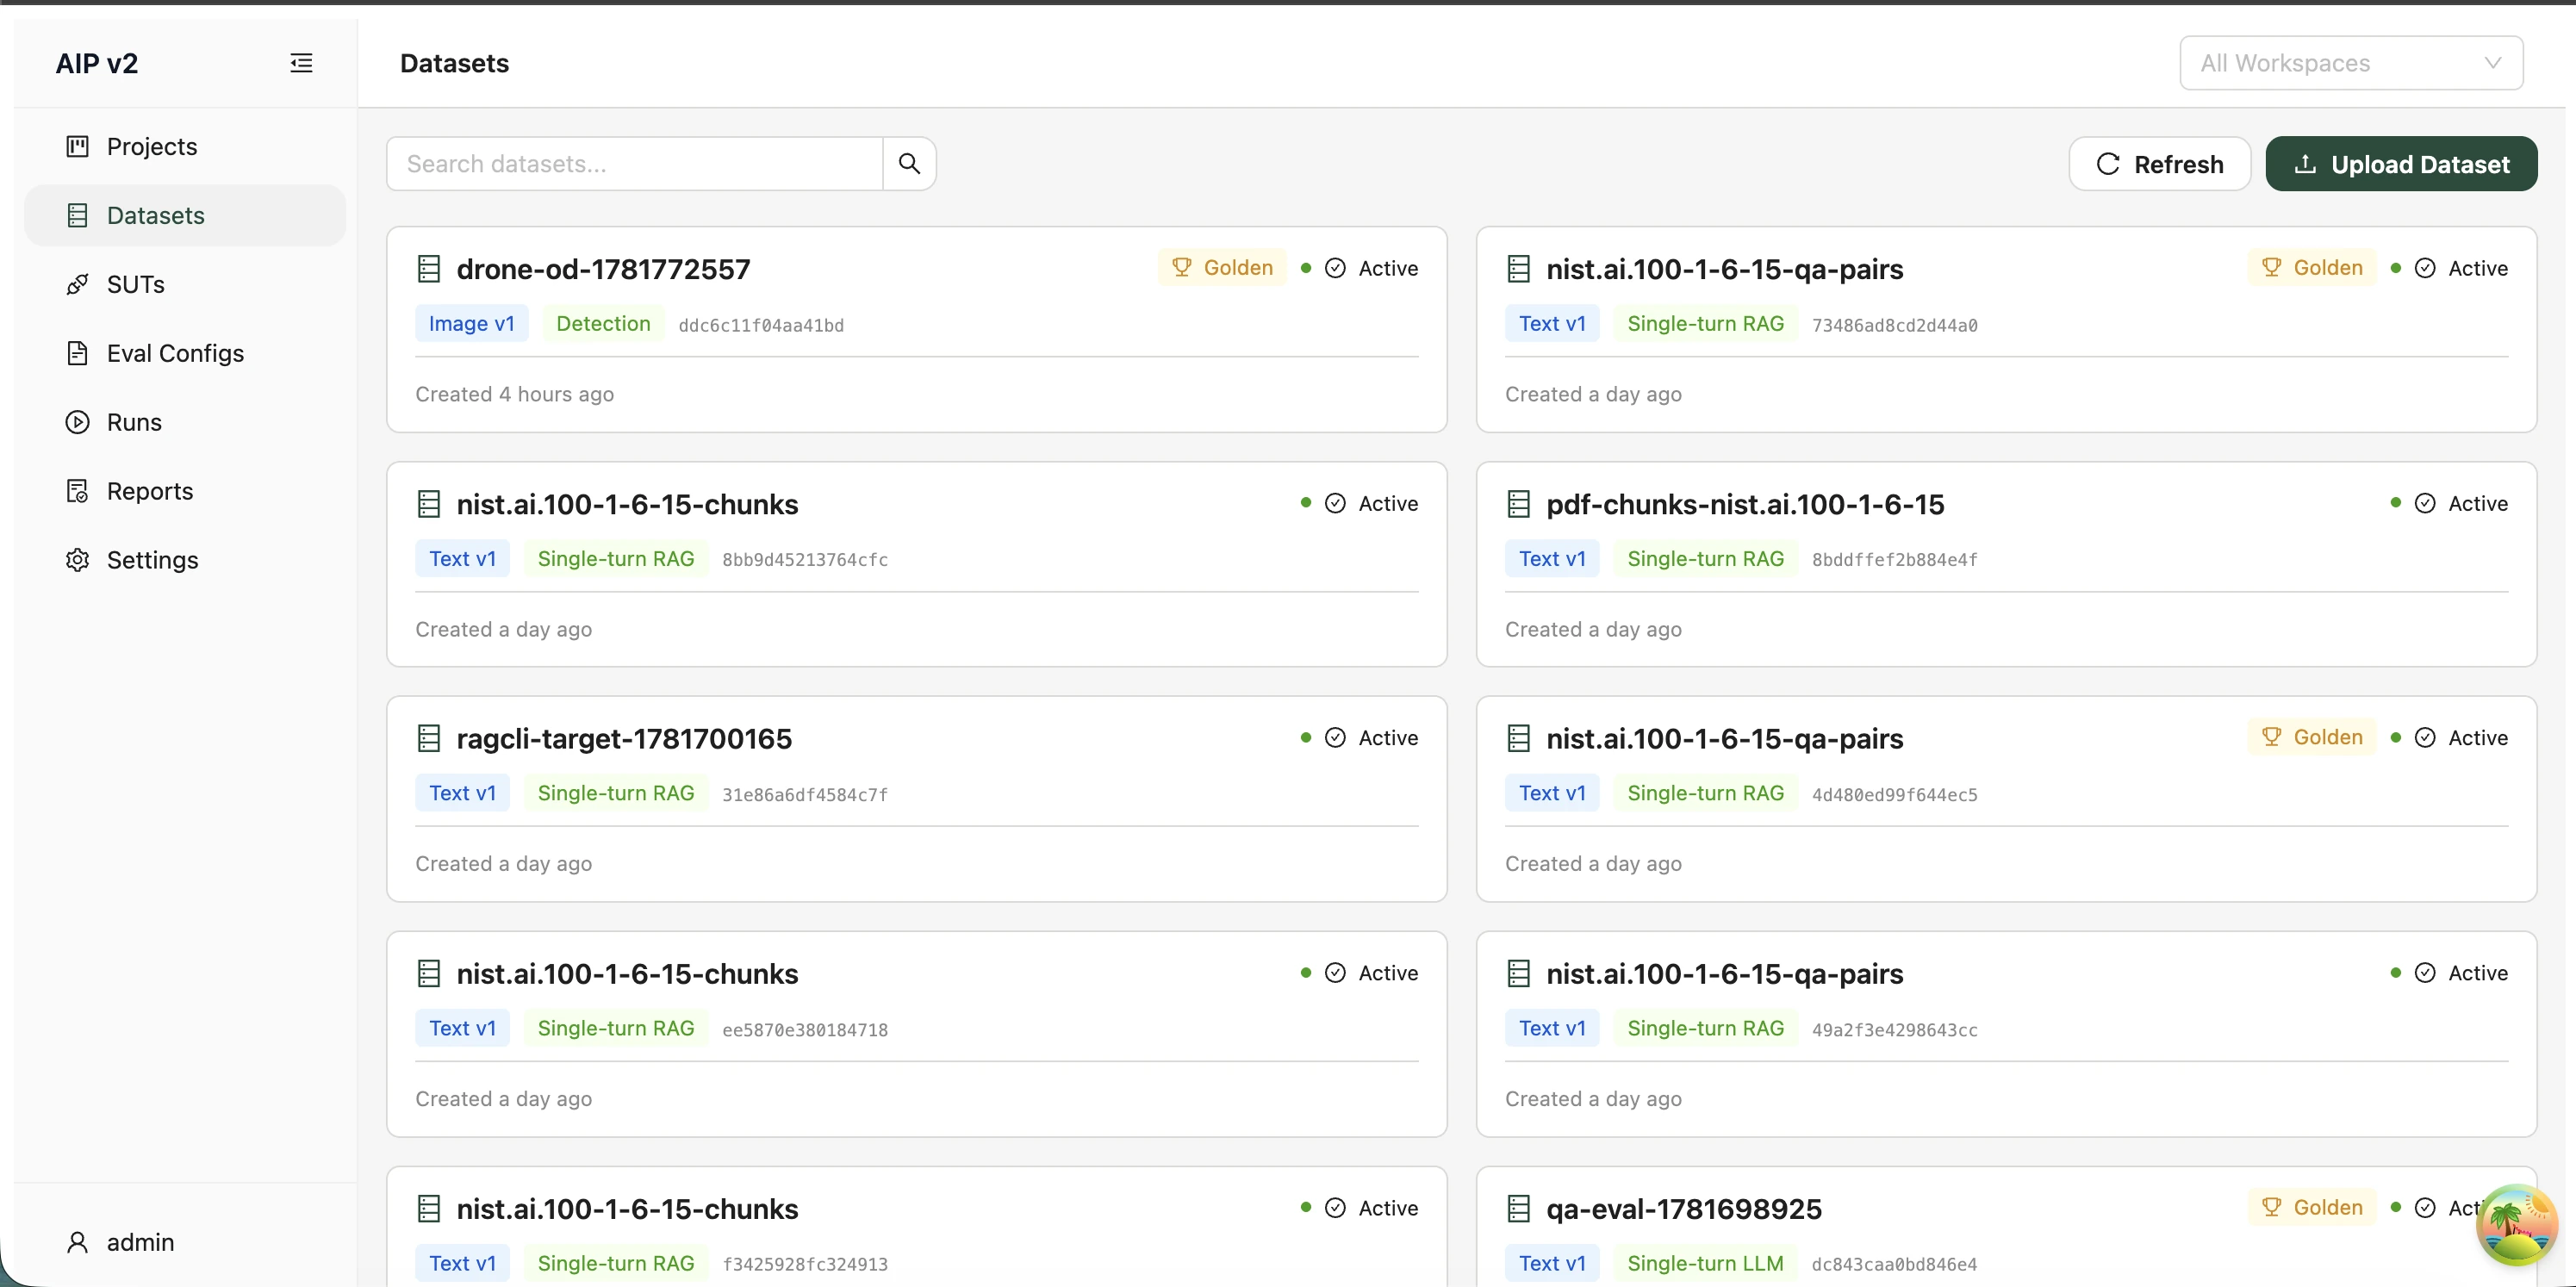
⬆️ Uploading a Dataset
The Upload Dataset modal registers a raw file as a new dataset:
- File — click or drag a file onto the dropzone. Supported formats: Parquet, CSV, JSON, JSONL. The file name pre-fills the dataset name.
- Dataset name — required, at least 3 characters (e.g.
chatbot-golden-v1). - GDI schema —
gdi_text_v1orgdi_image_v1. For an image schema, an extra Image task type field appears (classification / detection / segmentation / instance). - Project (optional) — associate the dataset with a project. When you do, the schema (and task type) are inherited from that project and locked.
Upload stays disabled until a file is selected. (Uploading from inside a project's Datasets tab pre-fills and locks the project + schema for you.)
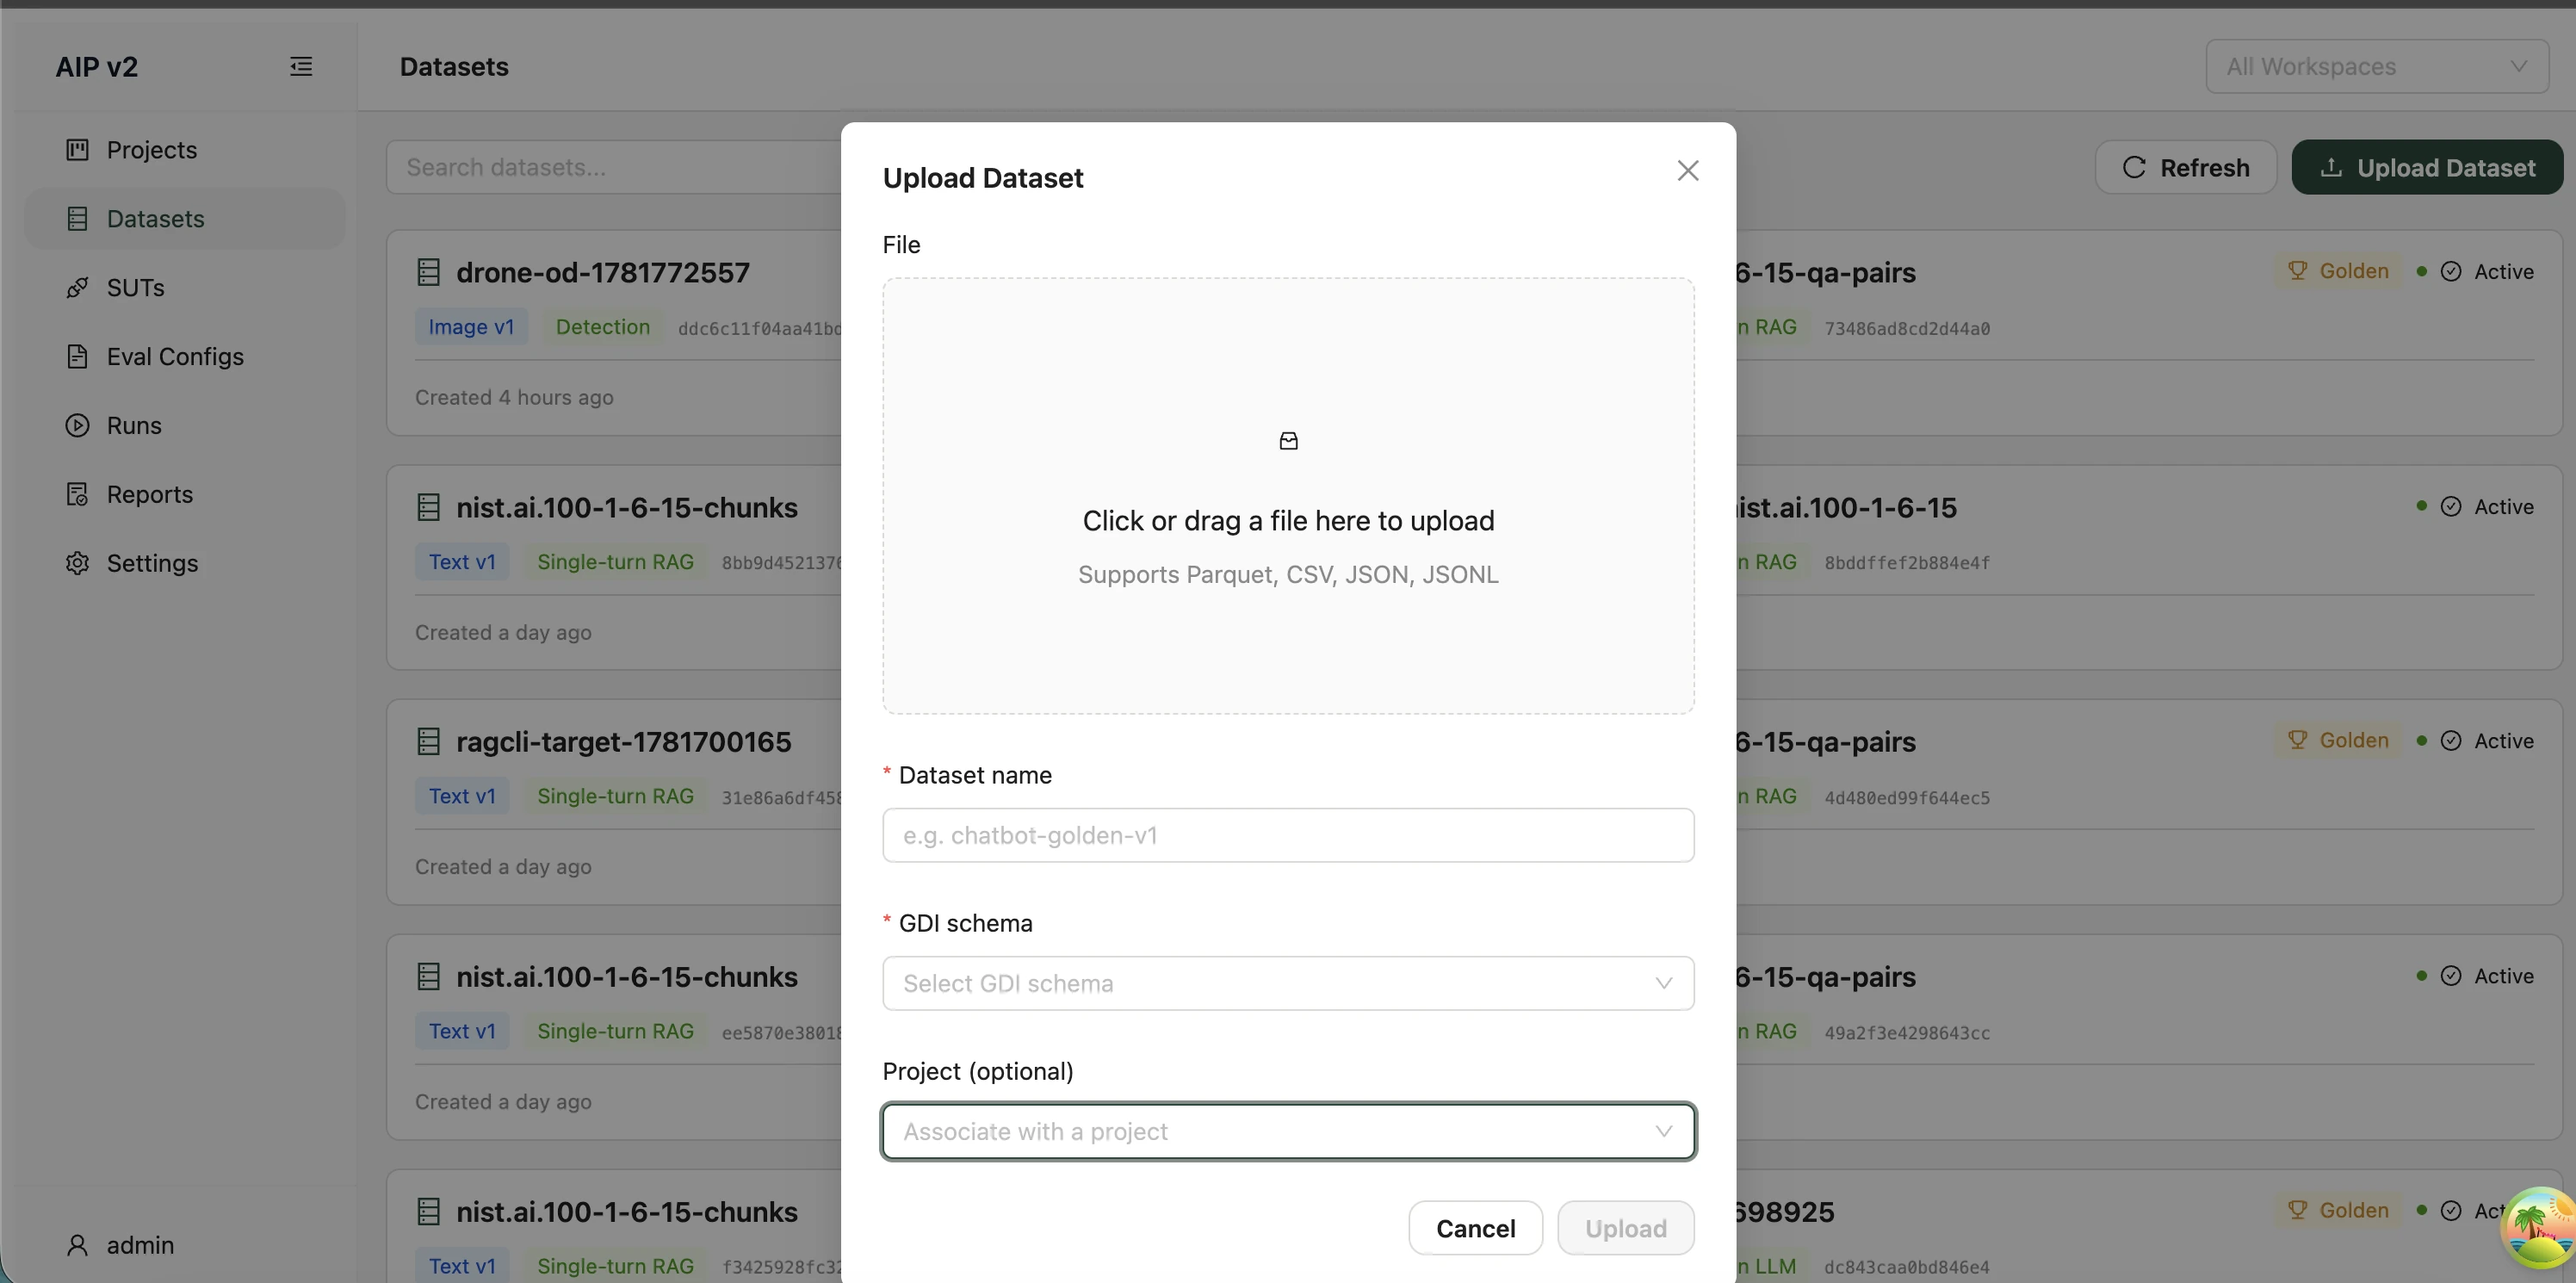
📄 The Dataset Detail Page
Clicking a dataset opens its detail page. The header summarises the schema, task type, status (with a gold Golden tag when a golden version exists), creation date, and a link to the owning project.
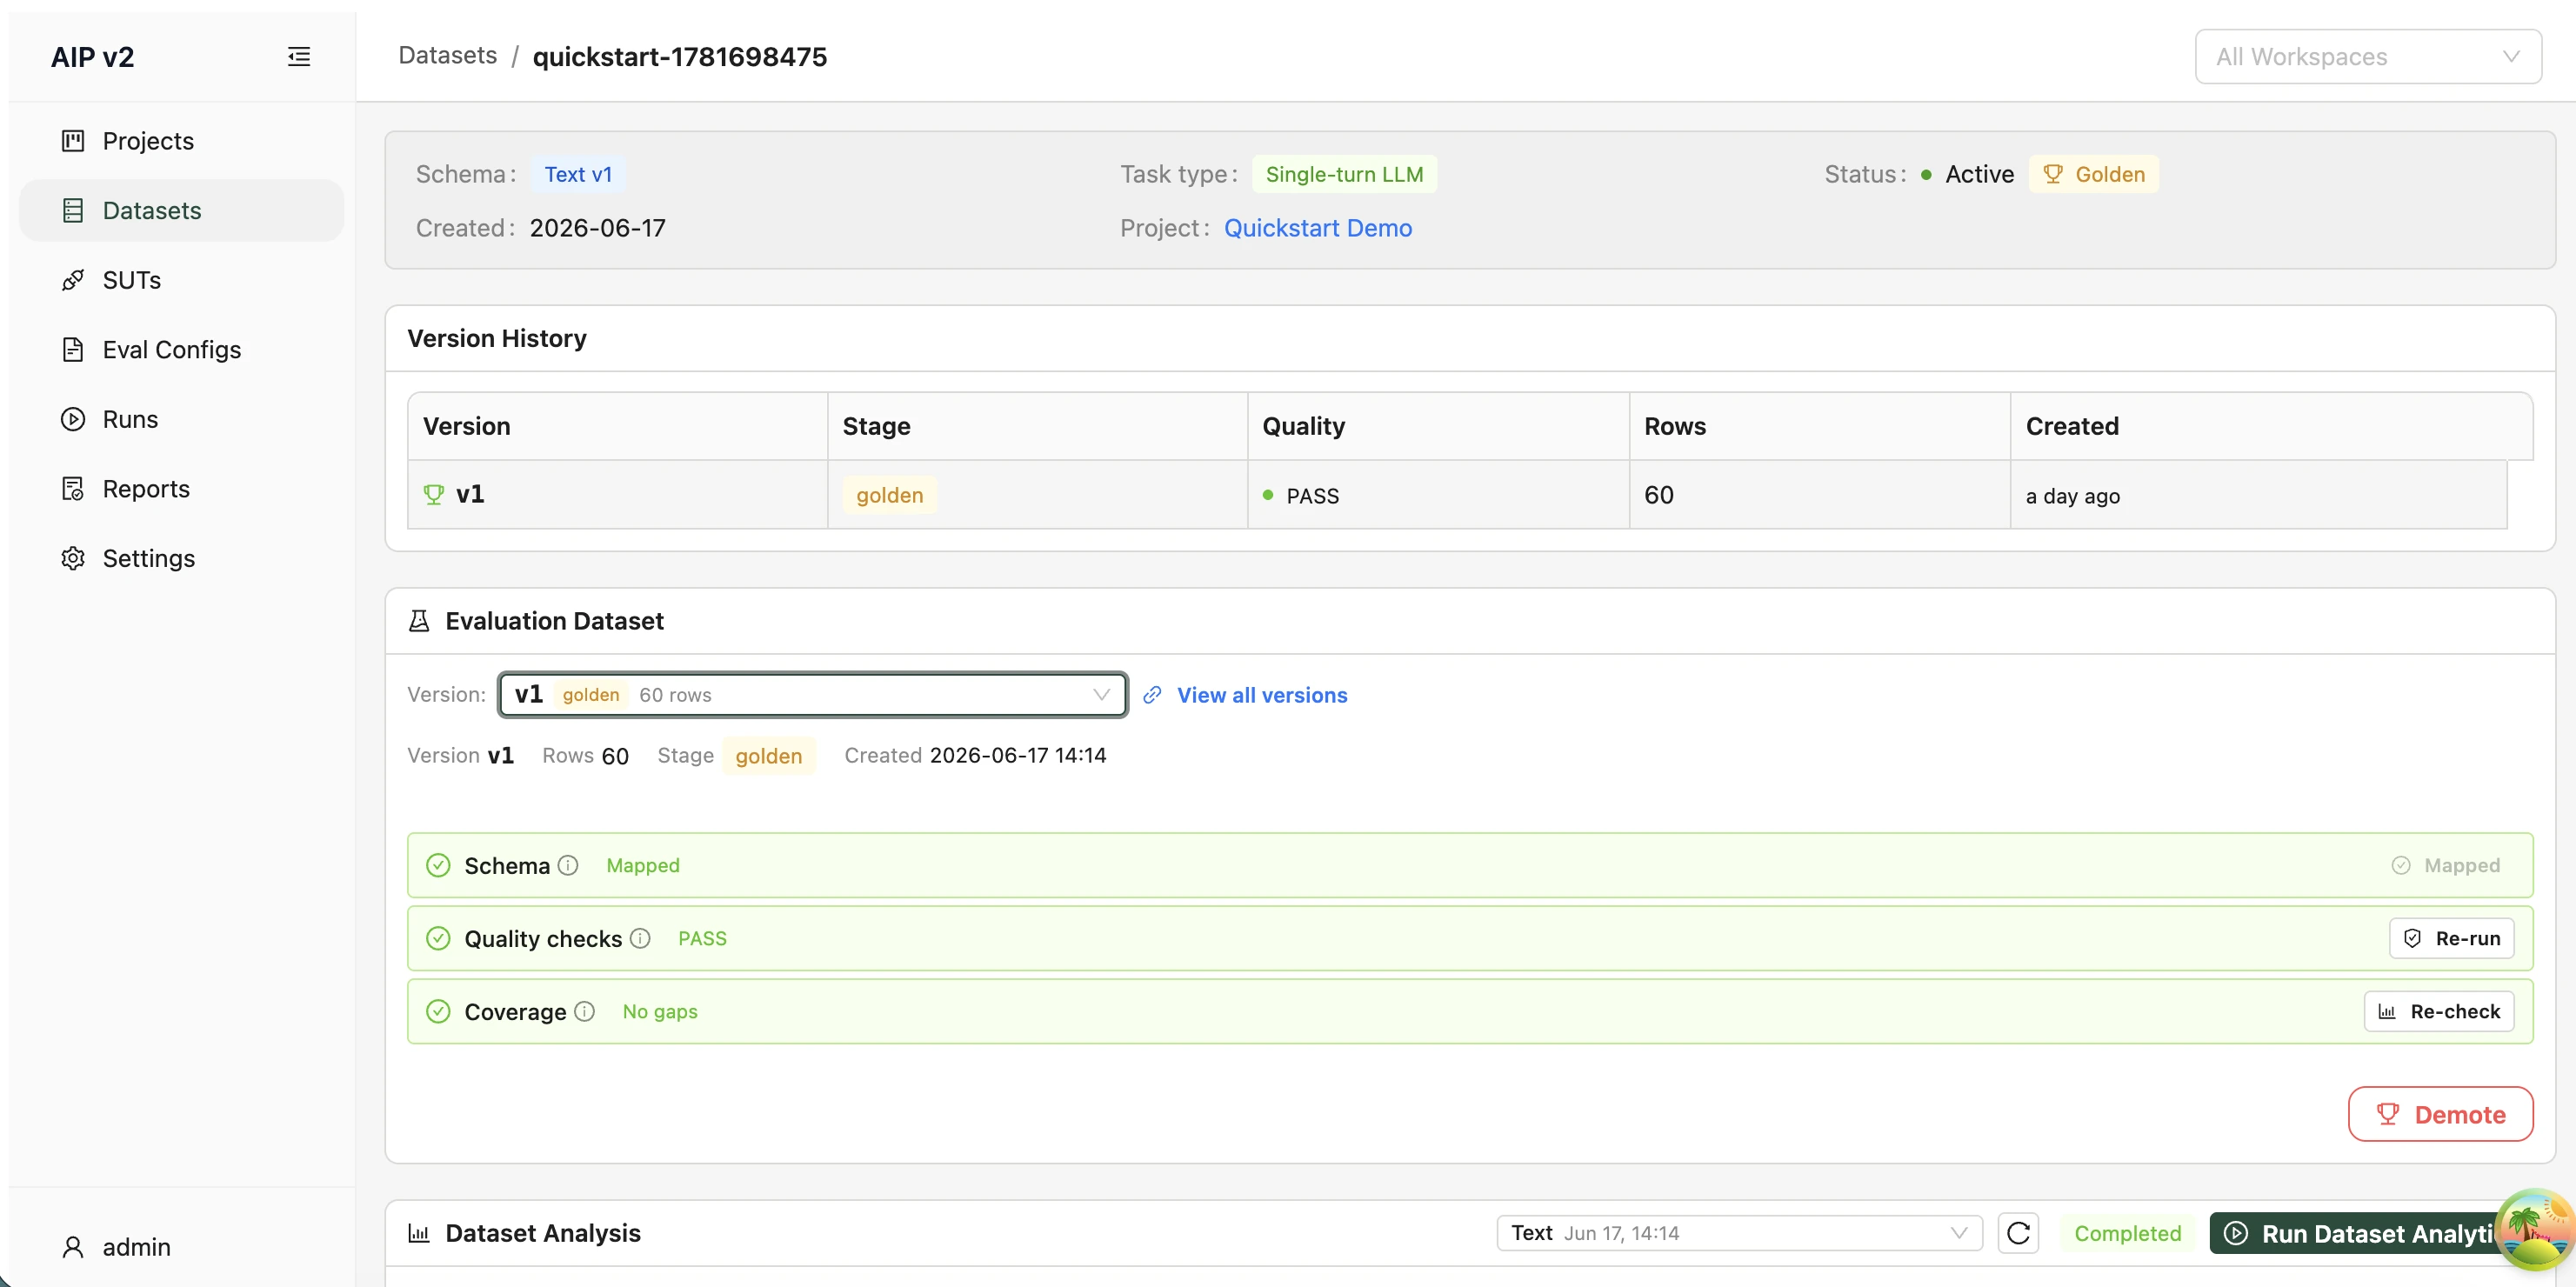
The Version History card lists every version with:
| Column | Meaning |
|---|---|
| Version | v1, v2, … — a 🏆 trophy marks the golden version; hover for the full version ID. |
| Stage | raw (just uploaded), mapped (column mapping applied), augmented (SDG-generated), or golden (promoted). |
| Quality | The latest quality verdict — PASS / WARN / FAIL / STALE / NOT_RUN (hover for detail). |
| Rows | Row count for that version. |
| Created | Relative timestamp (hover for the exact time). |
Click a row to select that version — the panels below (evaluation-readiness, analysis, quality, and preview) all follow the selected version. Mapping a raw version to the schema and promoting it to golden is covered in Dataset Quality & Golden below.
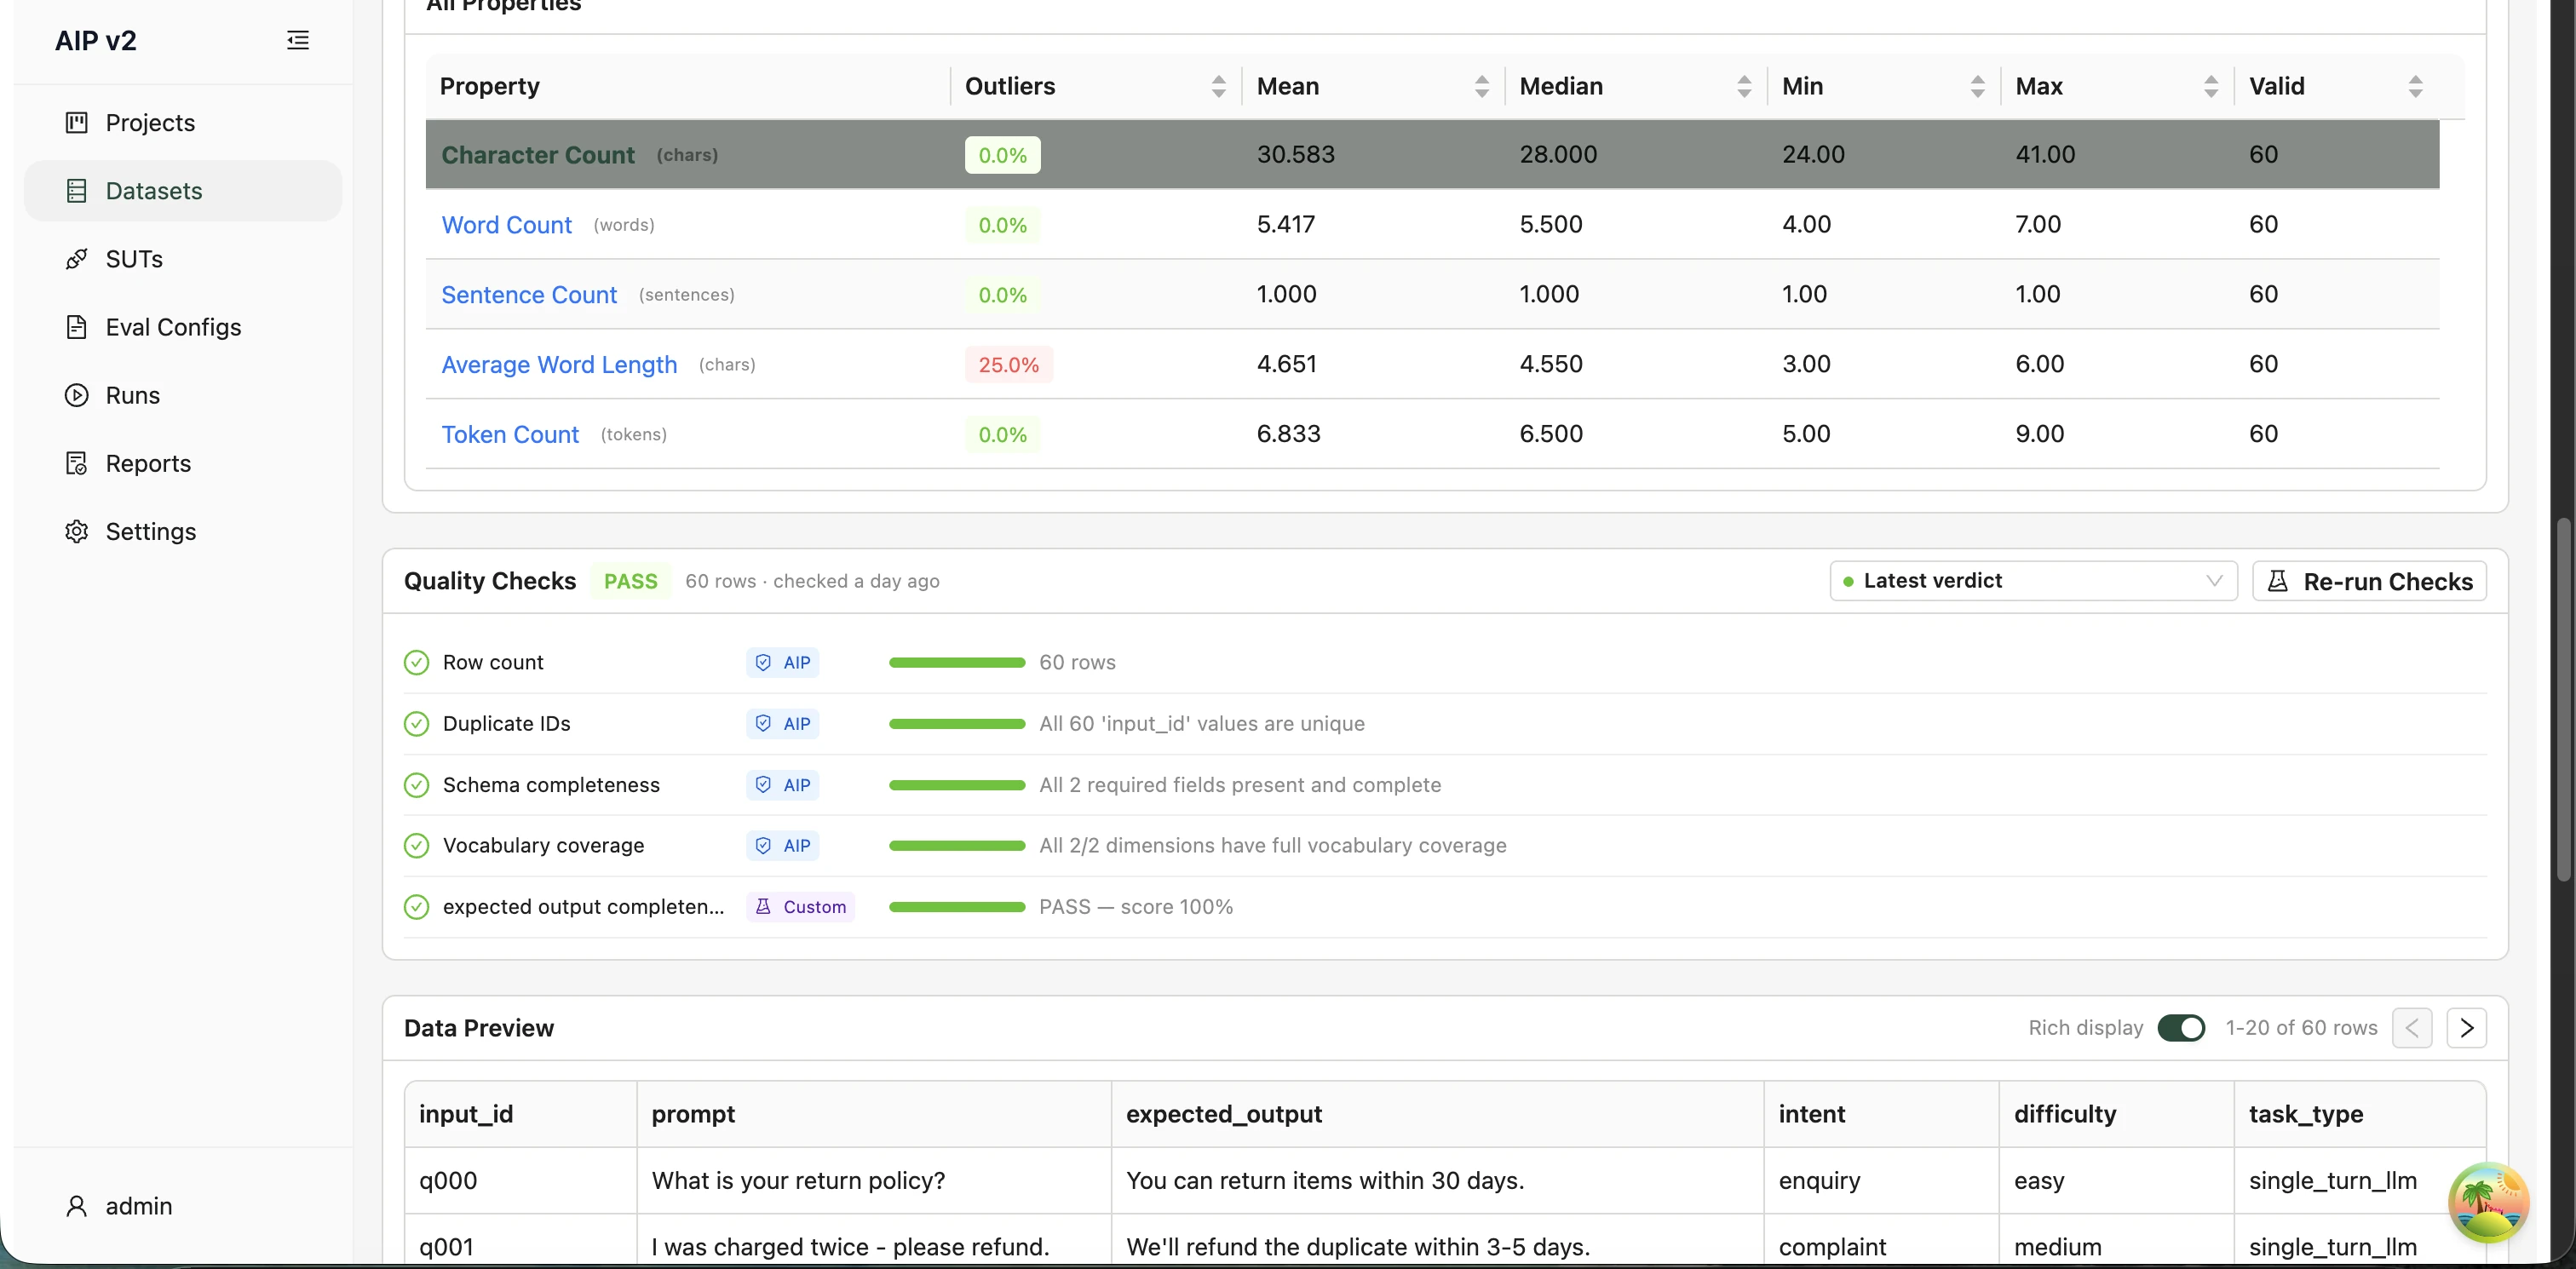
👁️ Data Preview
At the bottom of the page, the Data Preview panel renders the actual rows of the selected version, so you can eyeball the data without leaving the UI.
✅ Dataset Quality & Promoting to Golden
Before a dataset version can be used for evaluation it must be mapped to the GDI schema, pass quality checks, and be promoted to golden. The dataset detail page (and a project's Evaluation Dataset tab) surface three stacked panels that drive this workflow.
🧪 The Evaluation Dataset Readiness Card
The Evaluation Dataset card shows a version selector (with View all versions) and a 3-step readiness checklist for the selected version:
| Step | What it checks | Action |
|---|---|---|
| Schema | Columns are mapped to the project's GDI schema. | Map Schema (raw versions only — opens the mapping modal). |
| Quality checks | Deterministic data-quality gates have run and passed. | Run Quality Checks / Re-run. |
| Coverage | Per-class / per-dimension coverage has no gaps. | Check Class Coverage / Re-check. |
Each row is colour-coded — green ✓ (pass), amber ⚠ (warn / gaps), red ✕ (fail), or a spinner (pending) — with a status tag (Mapped, PASS, No gaps, …) and a hover-help tooltip.
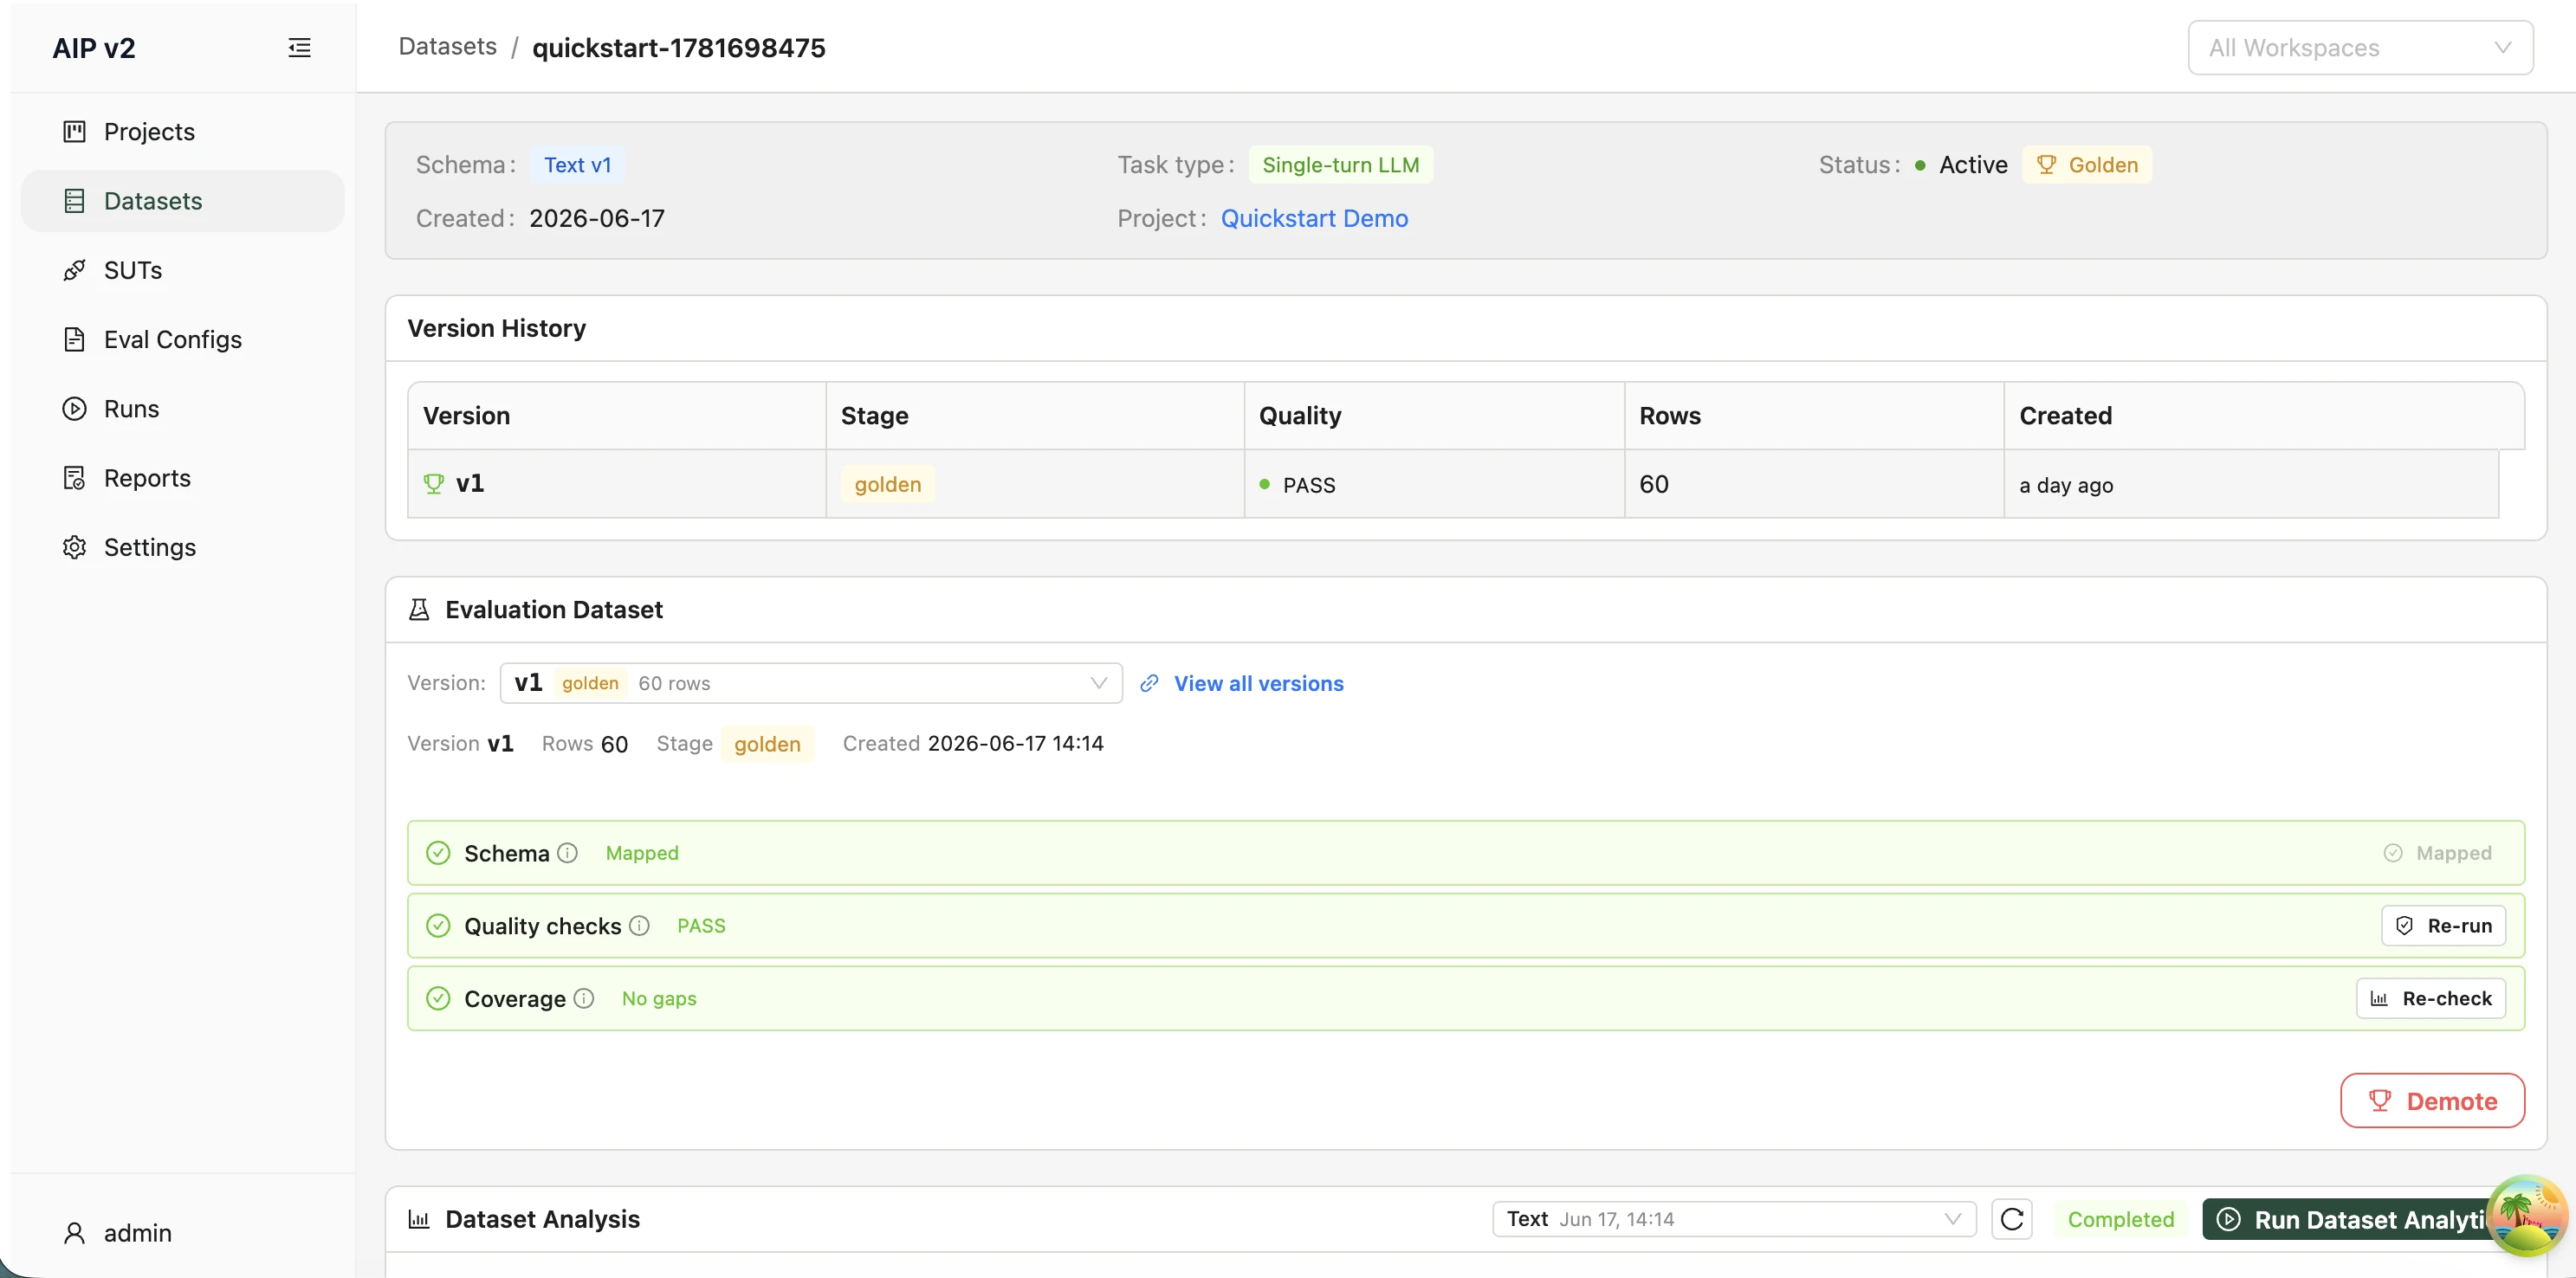
At the bottom is the gated Promote to Golden button:
- It is disabled until the version is mapped and the latest quality verdict is PASS — the tooltip explains exactly what's missing (e.g. "Quality checks must be run before promoting", "Cannot promote — checks failed").
- If the verdict is WARN, promoting is allowed but records an audited override (the tooltip reads "Quality verdict is WARN — promoting records an audited override").
- A golden version instead shows a red Demote button to remove golden status.
🛡️ The Quality Checks Panel
The Quality Checks panel shows the overall verdict (PASS / WARN / FAIL / STALE / NOT_RUN), the row count, and when checks last ran. Run Checks / Re-run Checks triggers a server-side run, and a selector lets you view the Latest verdict or a specific historical run.
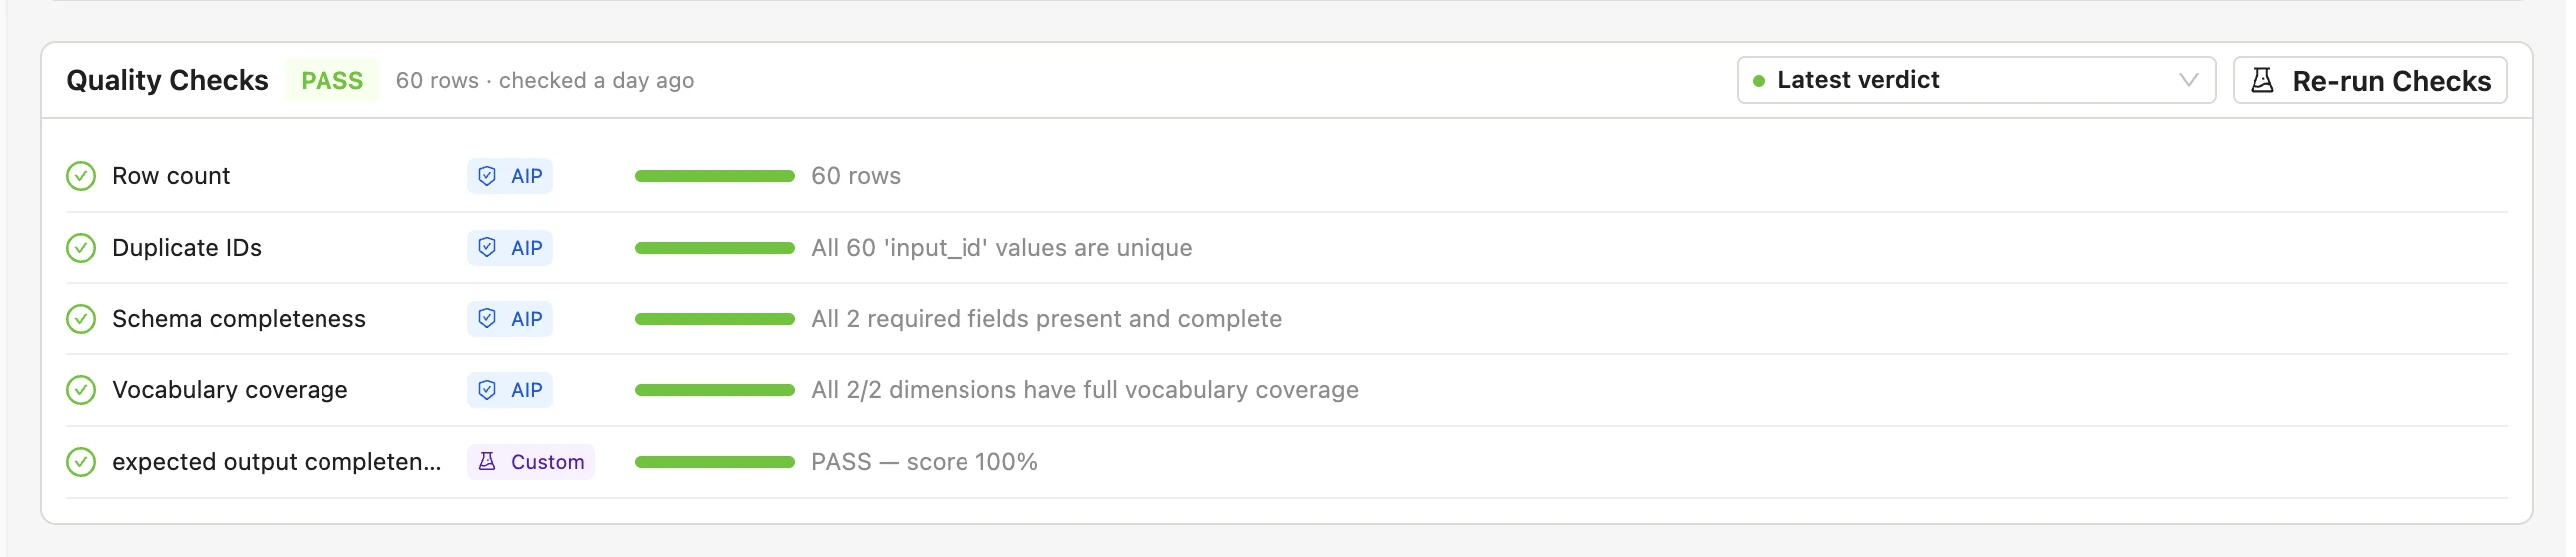
Each individual check is a row with its name, a pass/fail score, a built-in vs. custom tag, and a message. Typical checks include Row count, Schema conformance, Required field null rate, Duplicate IDs, Dimension coverage, Text length profile, Image properties, Vocabulary coverage, and Schema completeness.
📊 The Dataset Analysis Panel
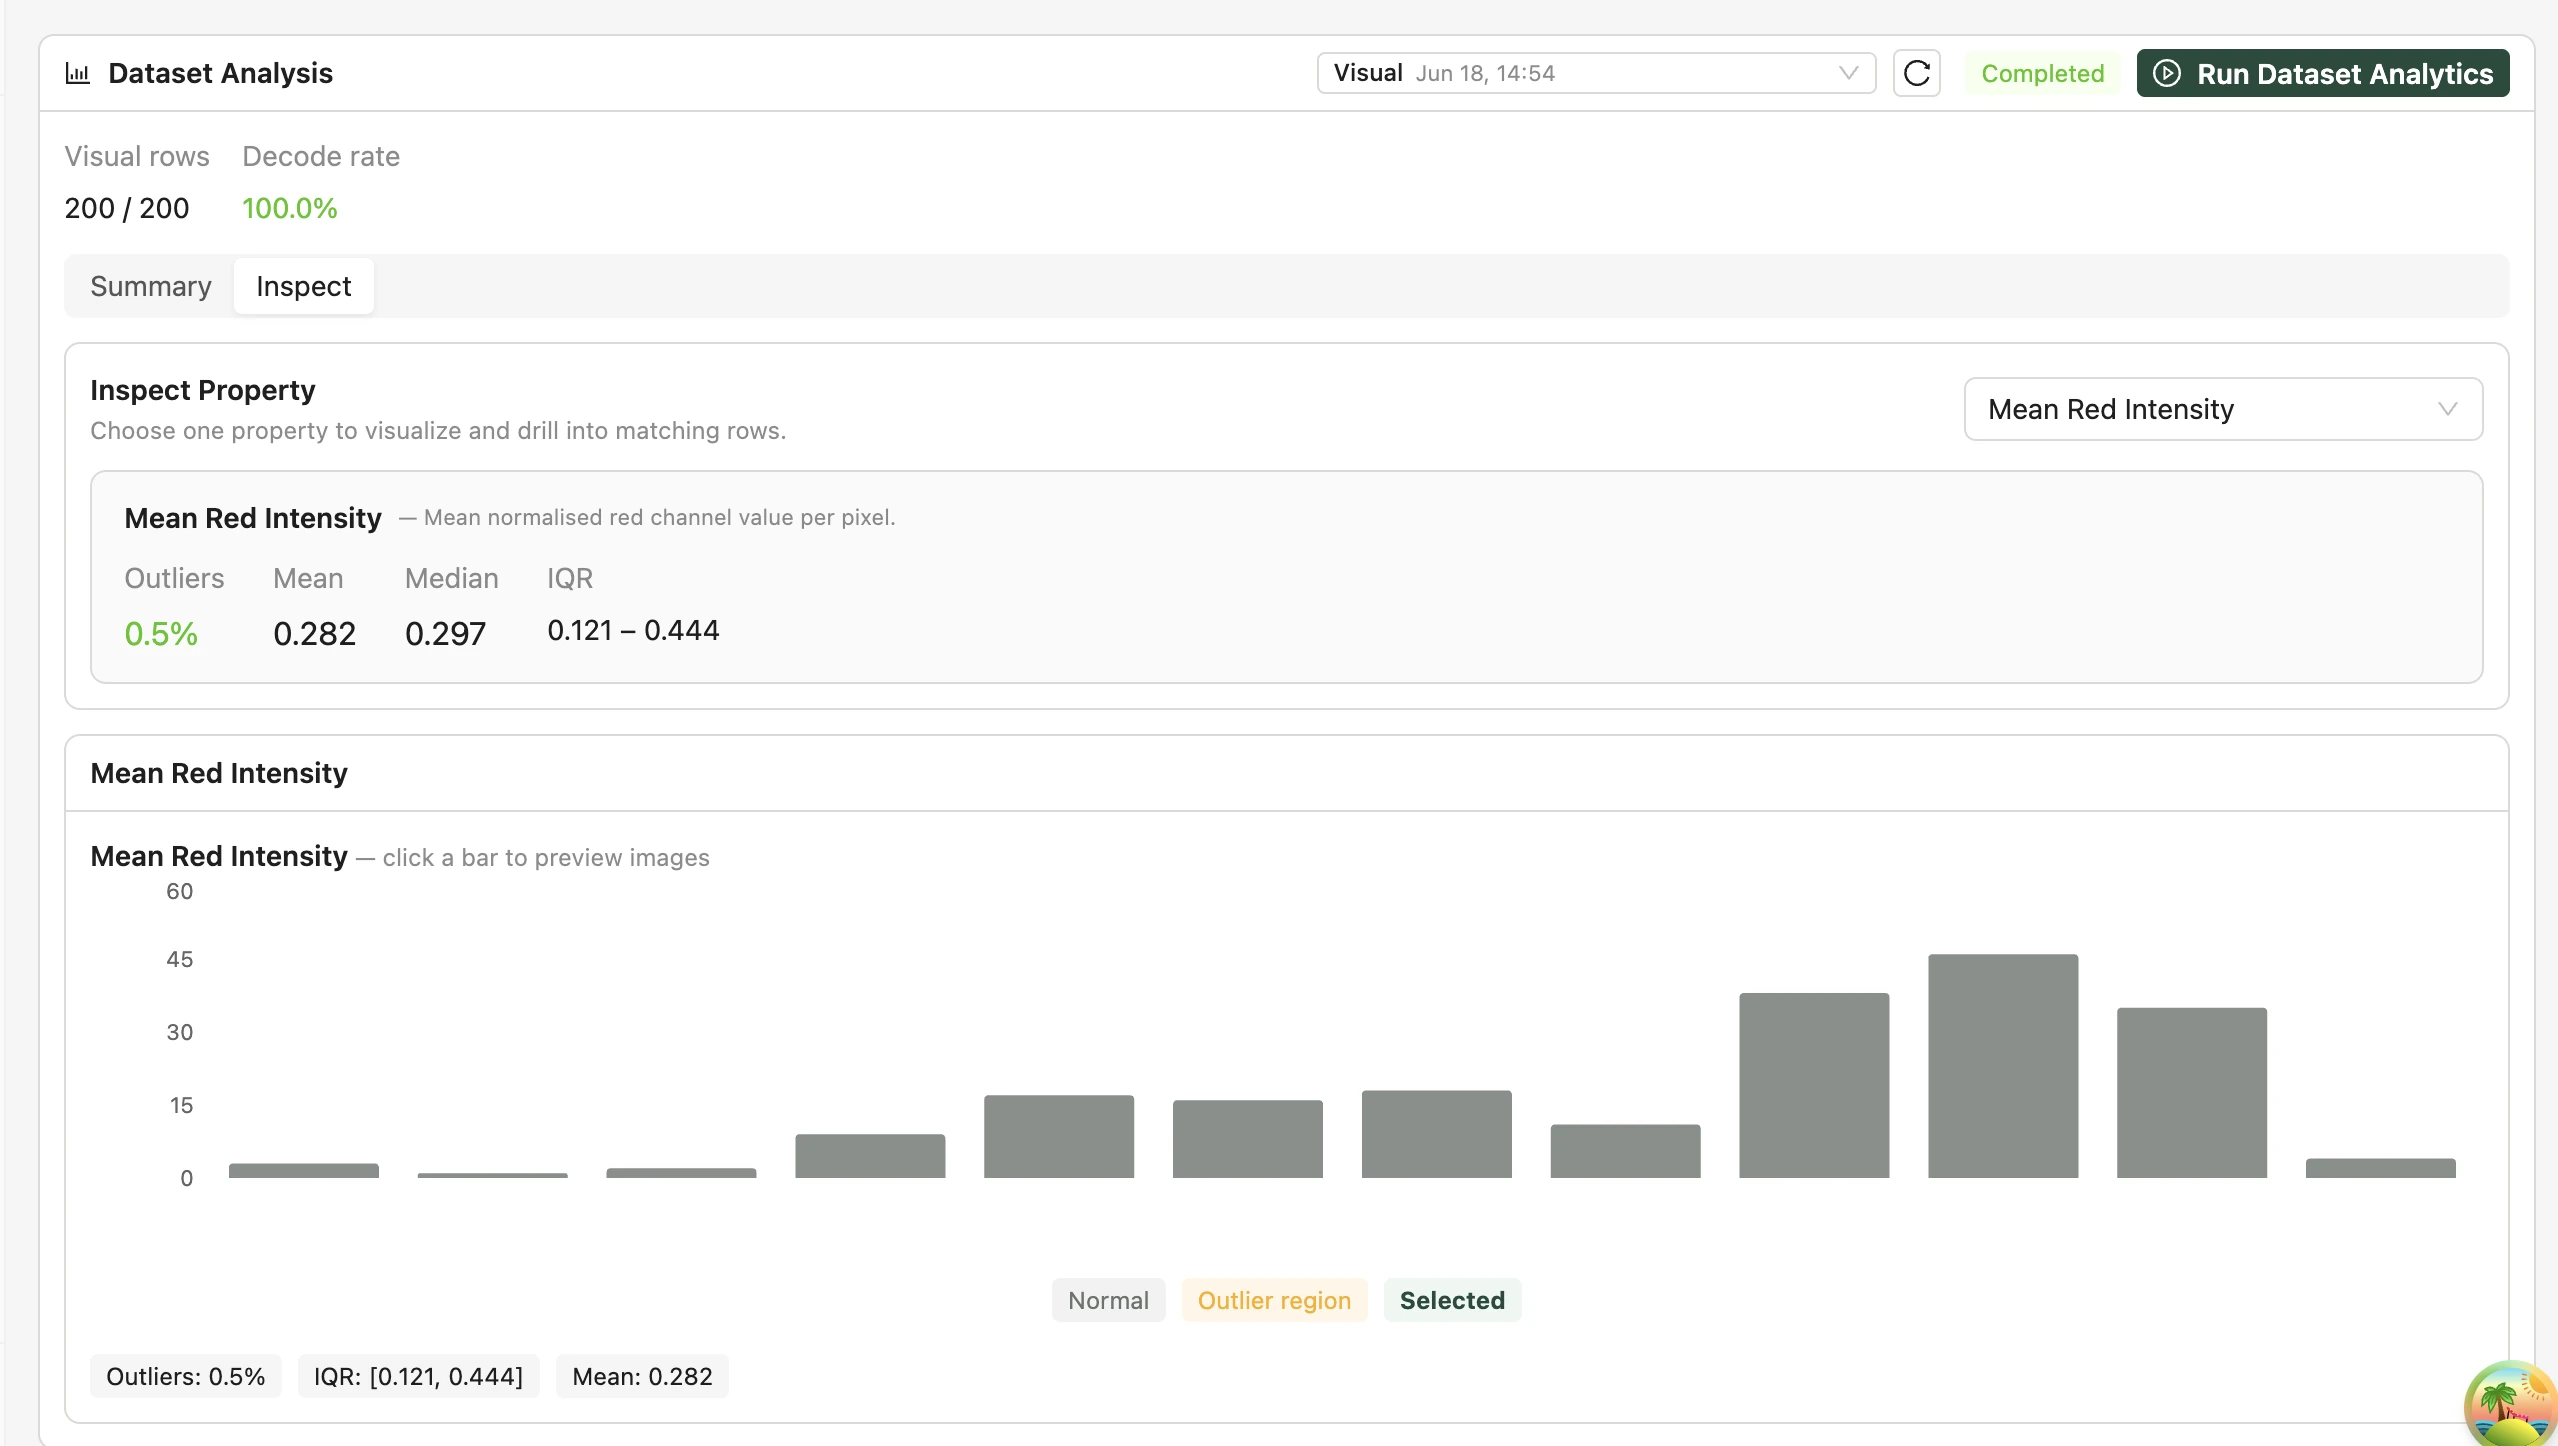
Separate from the pass/fail quality verdict, Dataset Analysis profiles the data for exploration (it never affects the verdict). Click Run Dataset Analytics to start a run; while it runs the panel shows "Running analysis…". When complete, a summary strip appears with a Summary / Inspect toggle.
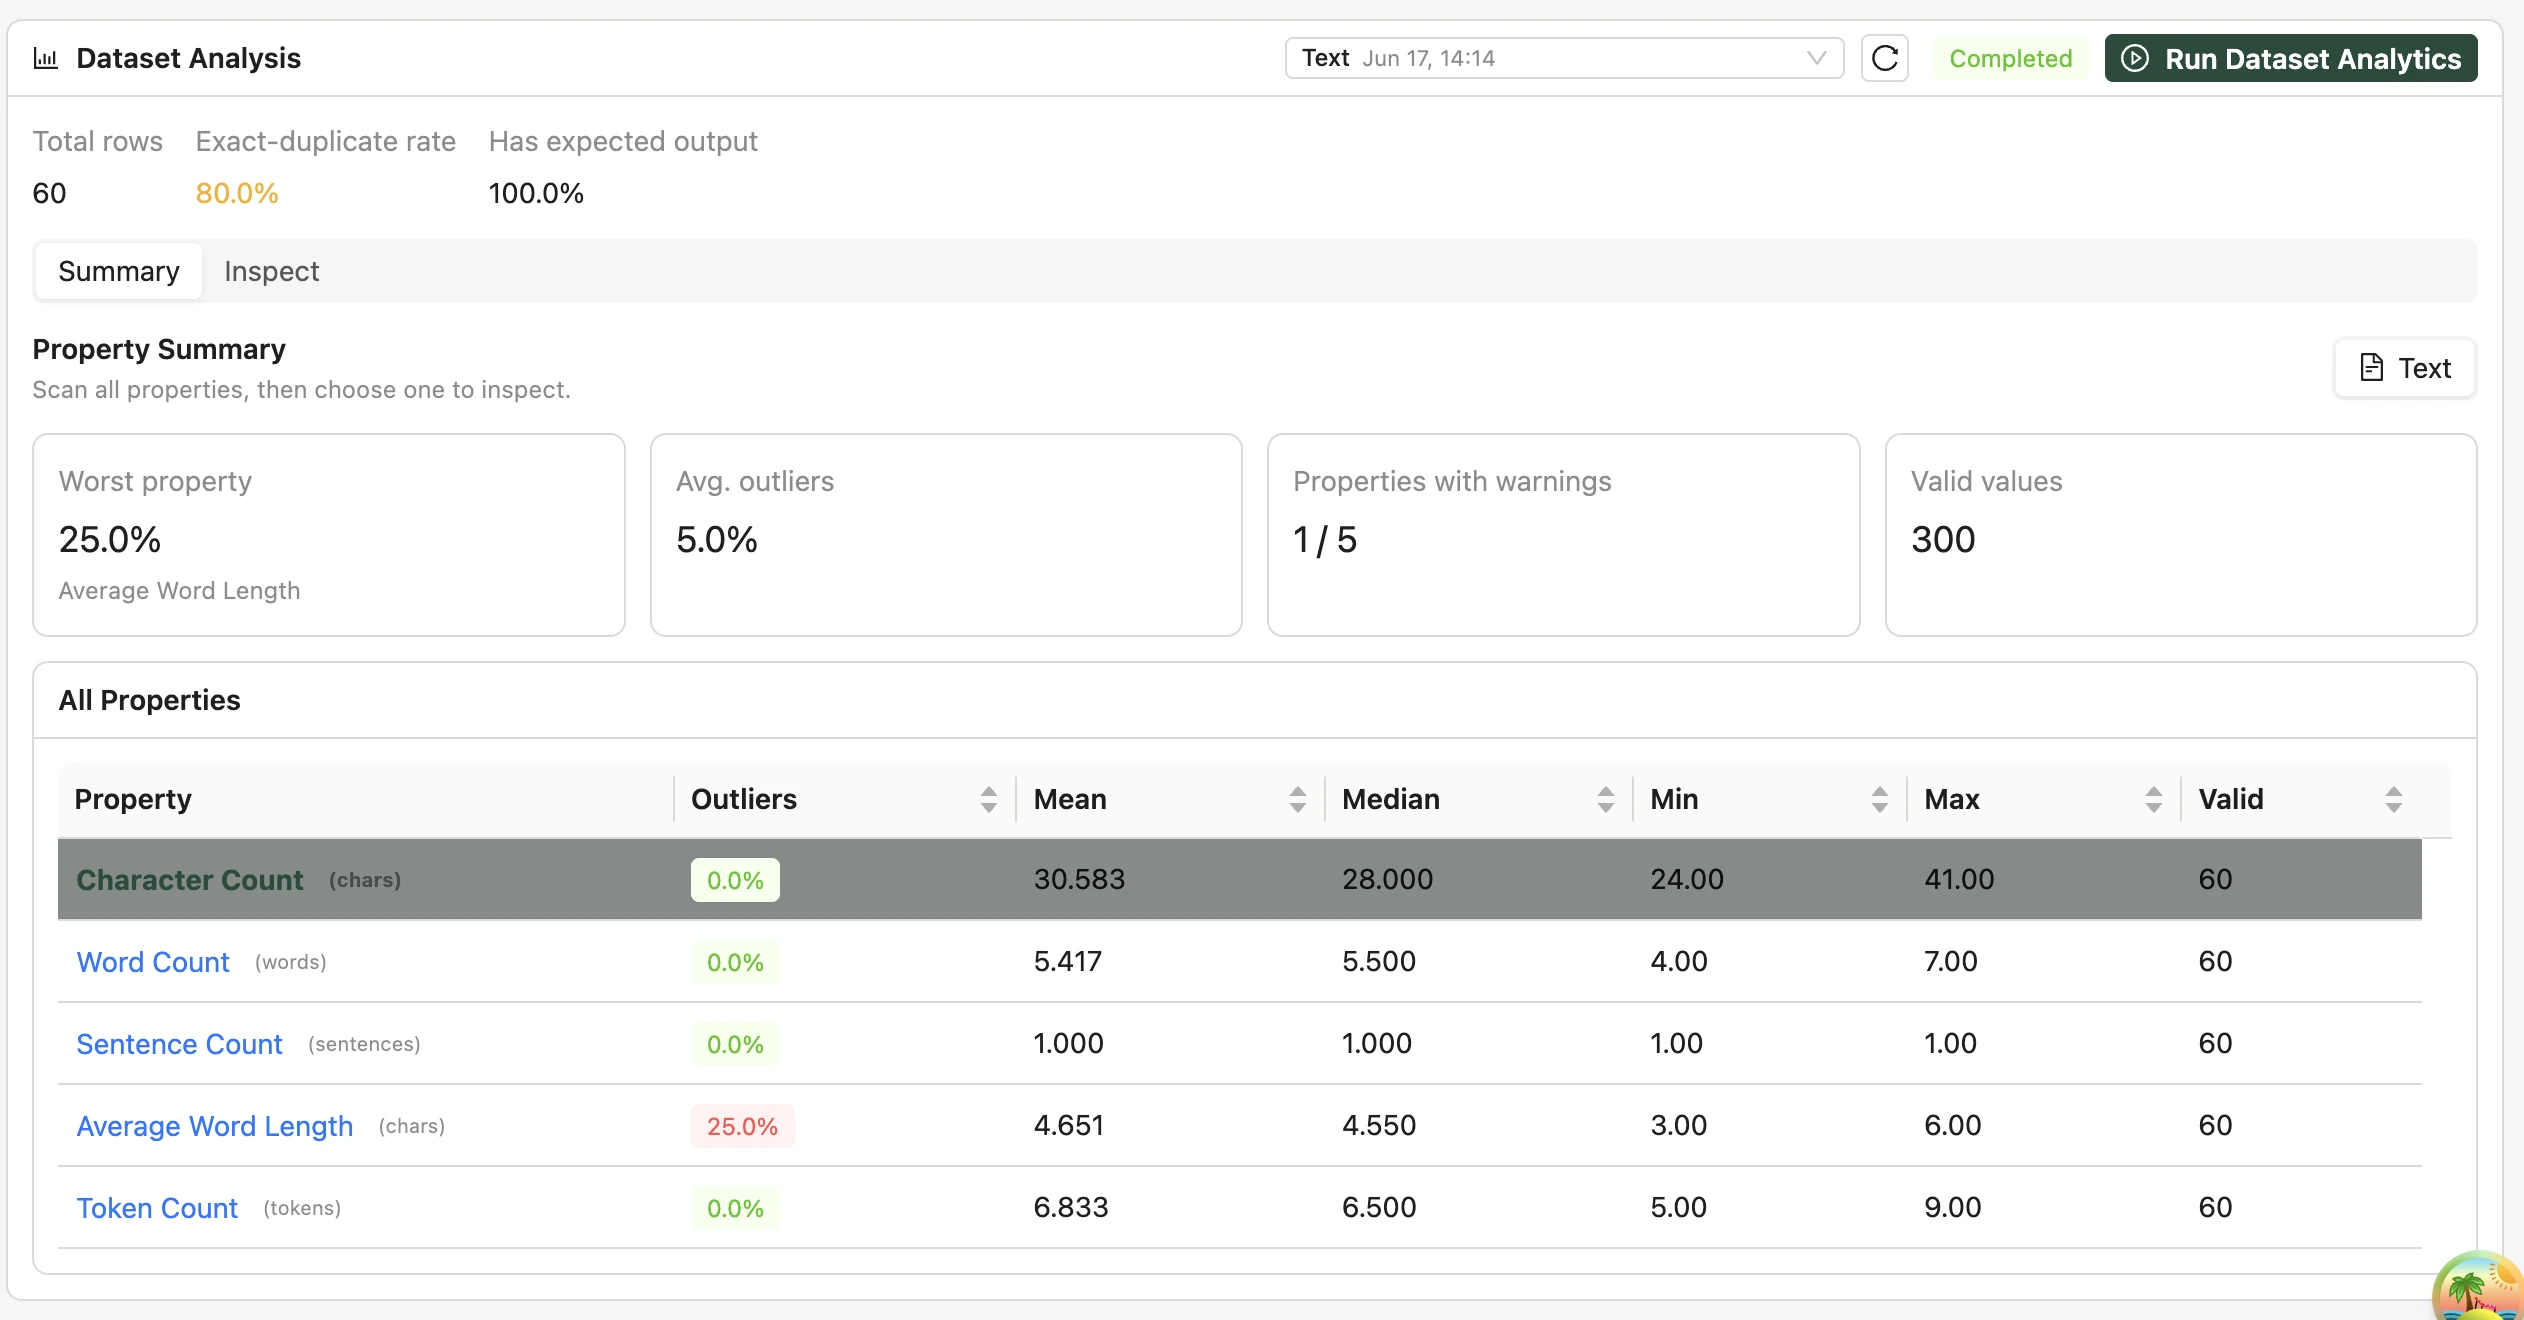
For image datasets the analysis profiles visual properties (brightness, size, etc.), and the Inspect tab renders each image with its bounding-box overlay so you can eyeball annotations directly in the UI.
SDK equivalent: the same lifecycle is available programmatically —
dataset.run_checks(),dataset.promote()/dataset.demote(), anddataset.run_analysis()/dataset.visual_analysis(). See Dataset operations.
🔌 SUTs (Systems Under Test)
A System Under Test is the AI model or service you want to evaluate. Each SUT can have multiple connections — one per environment (e.g. production, staging) — and each connection carries its endpoint, authentication, protocol, and a response parser that maps the raw API response into GDI output fields.
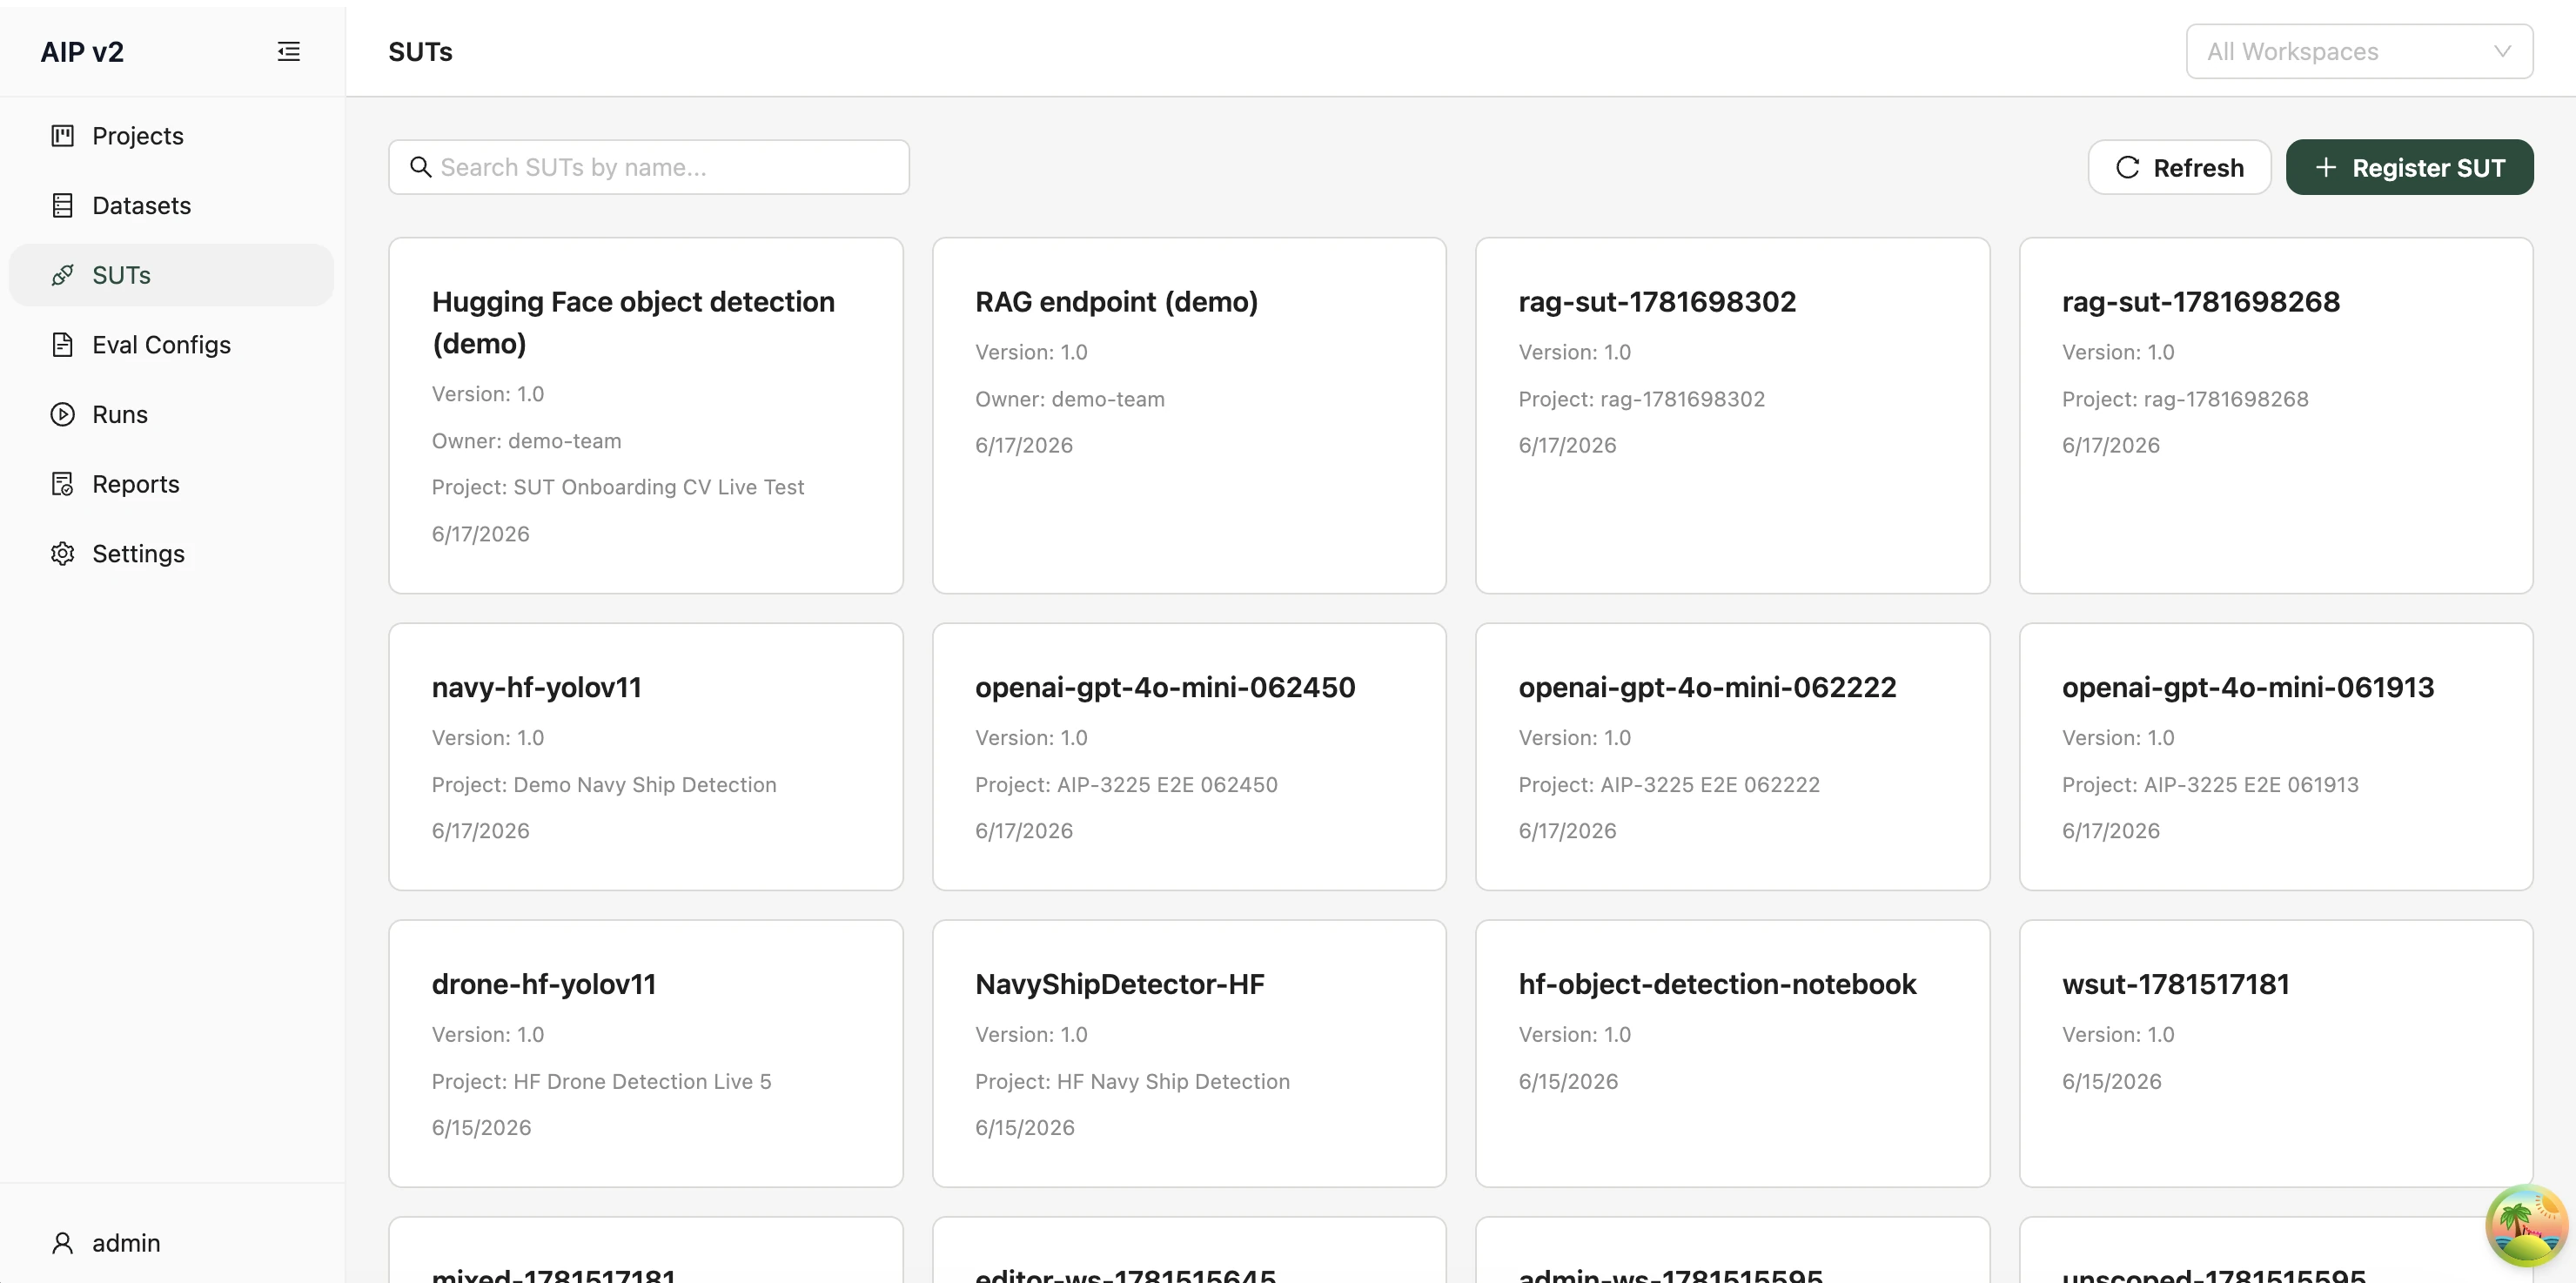
➡️ The SUTs List
Open /suts. Each SUT is a card showing its name, version, owner, and project. Search SUTs by name… filters the list, and Register SUT opens the registration modal.
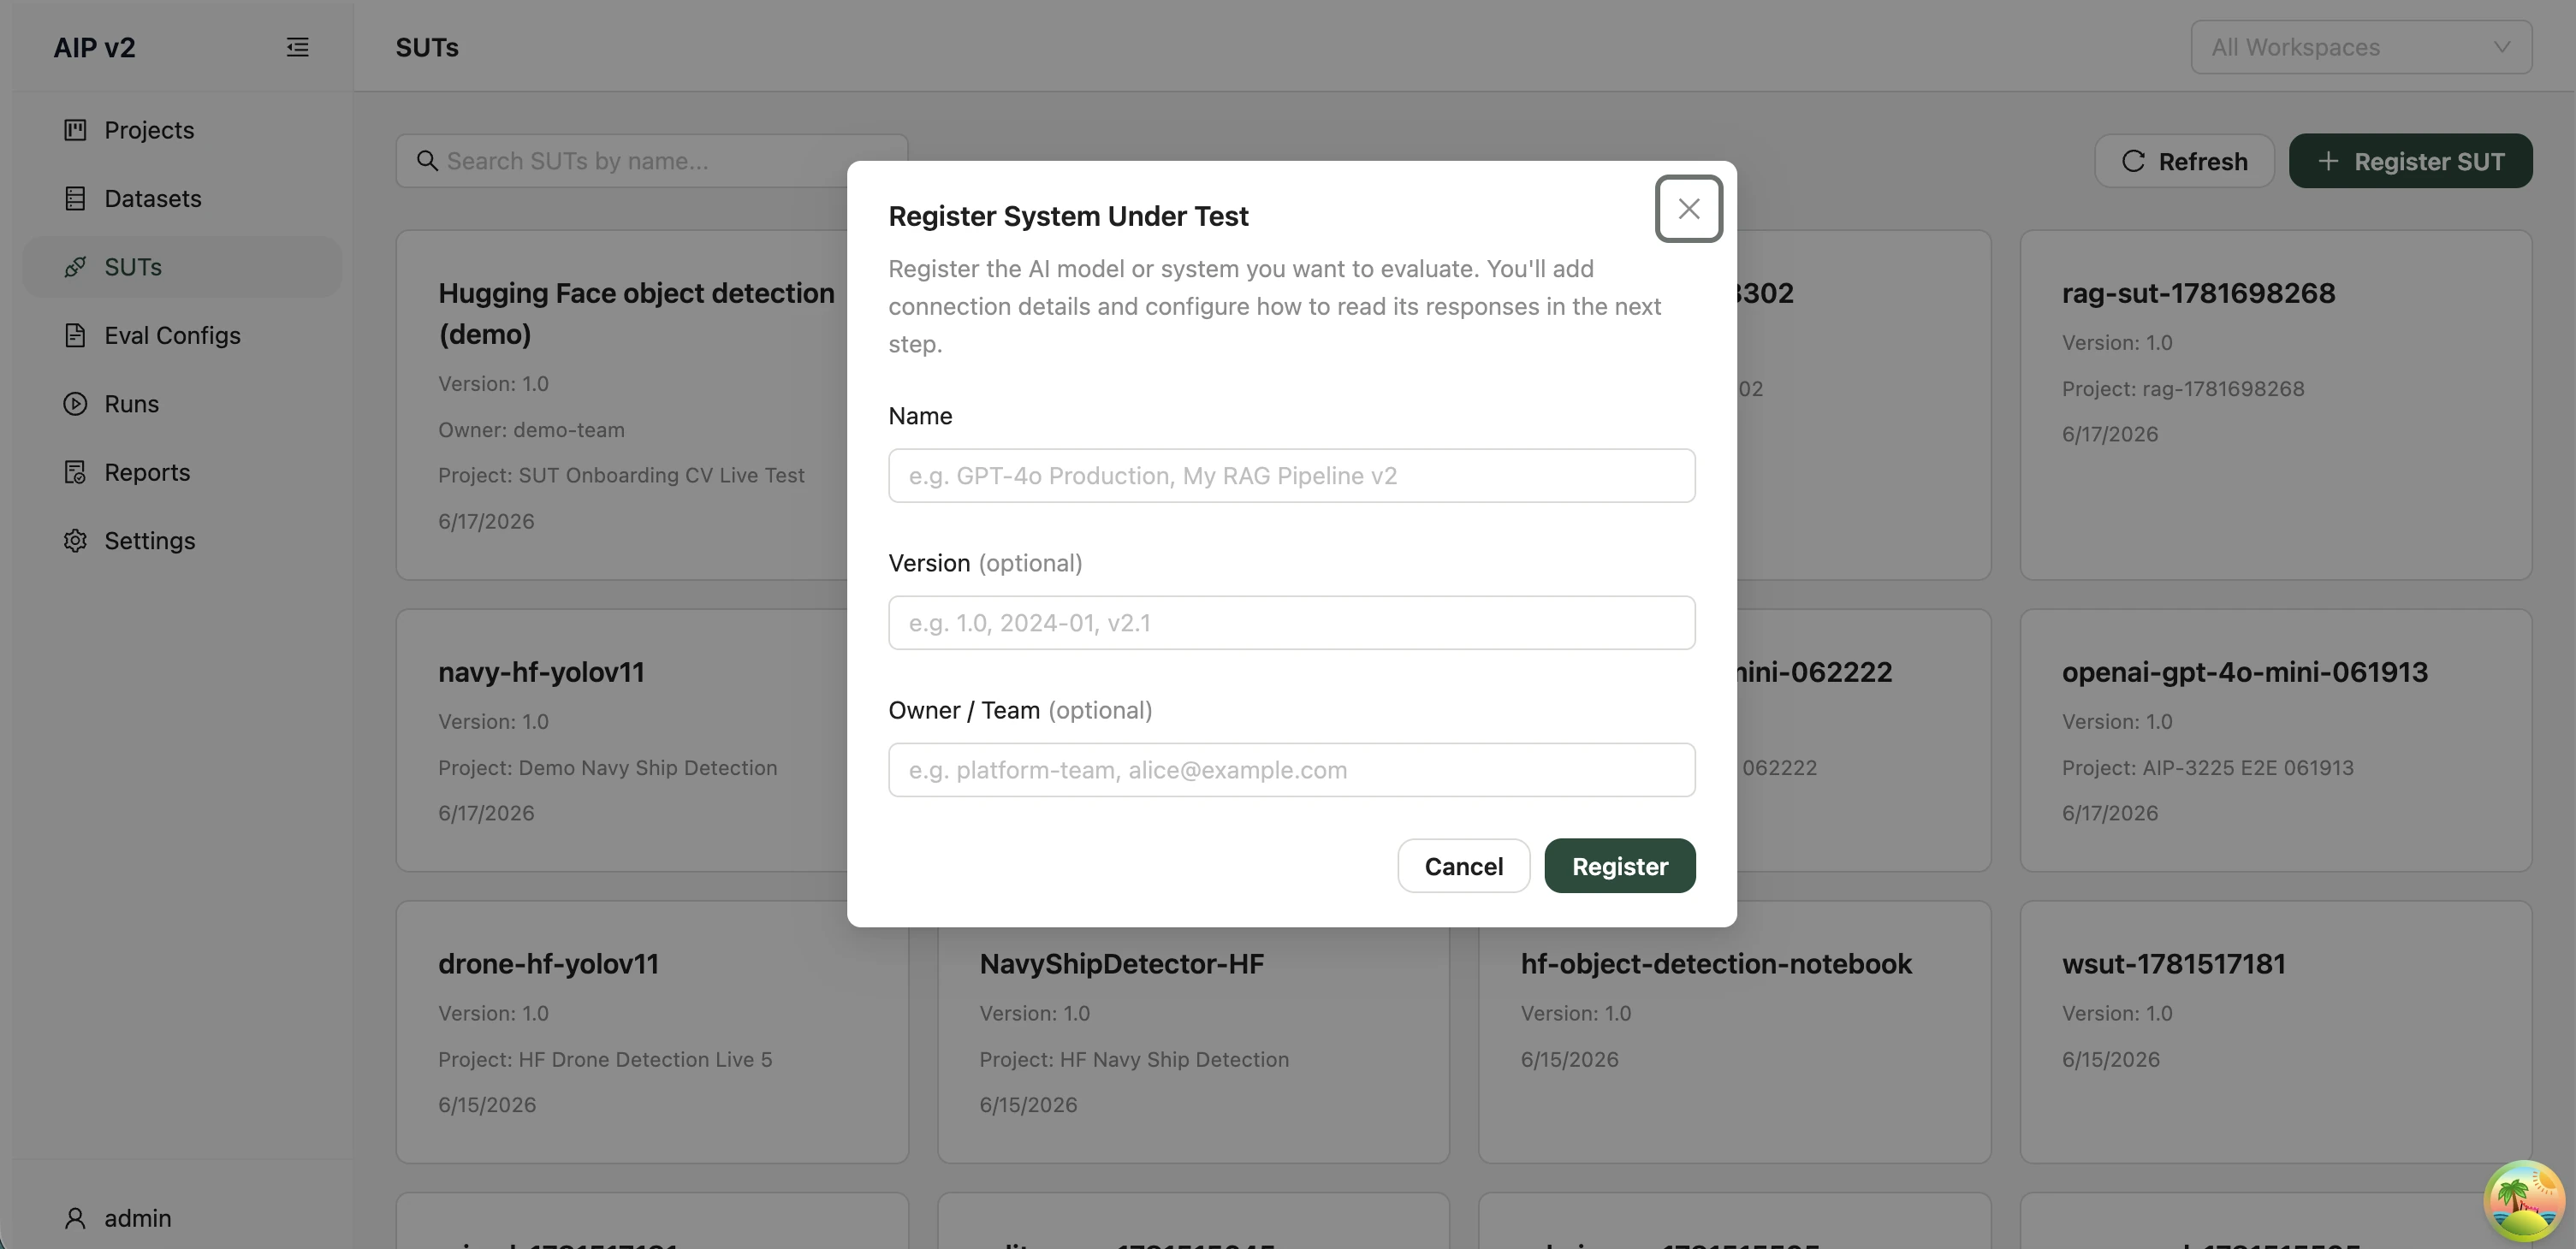
✳️ Registering a SUT
Register SUT captures just the identity of the model — Name (required), Version, and Owner / Team. Connection details come next, on the detail page.
🔧 The SUT Detail Page
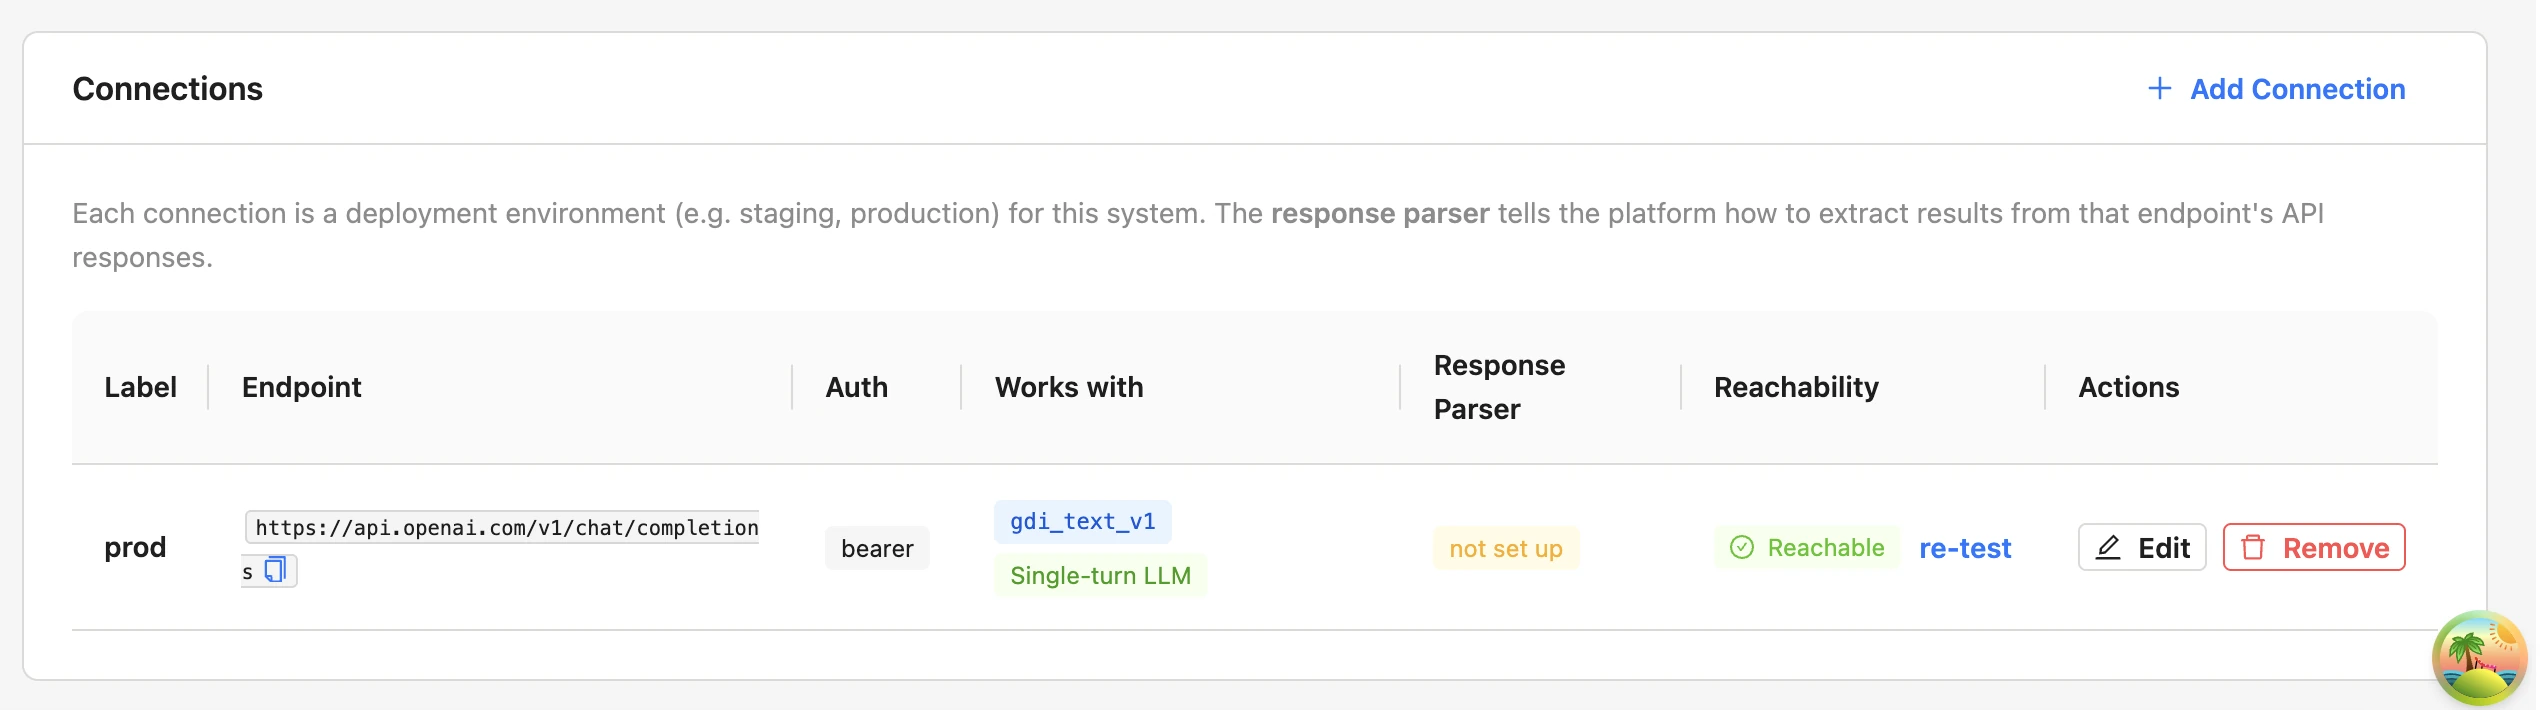
The detail page has a SUT Information card (name, version, owner, project) and a Connections table. Each connection row shows its label, endpoint URL, auth type, compatible dataset format (GDI schema/task), an adapter badge, and a reachability badge — plus Edit and Remove actions.
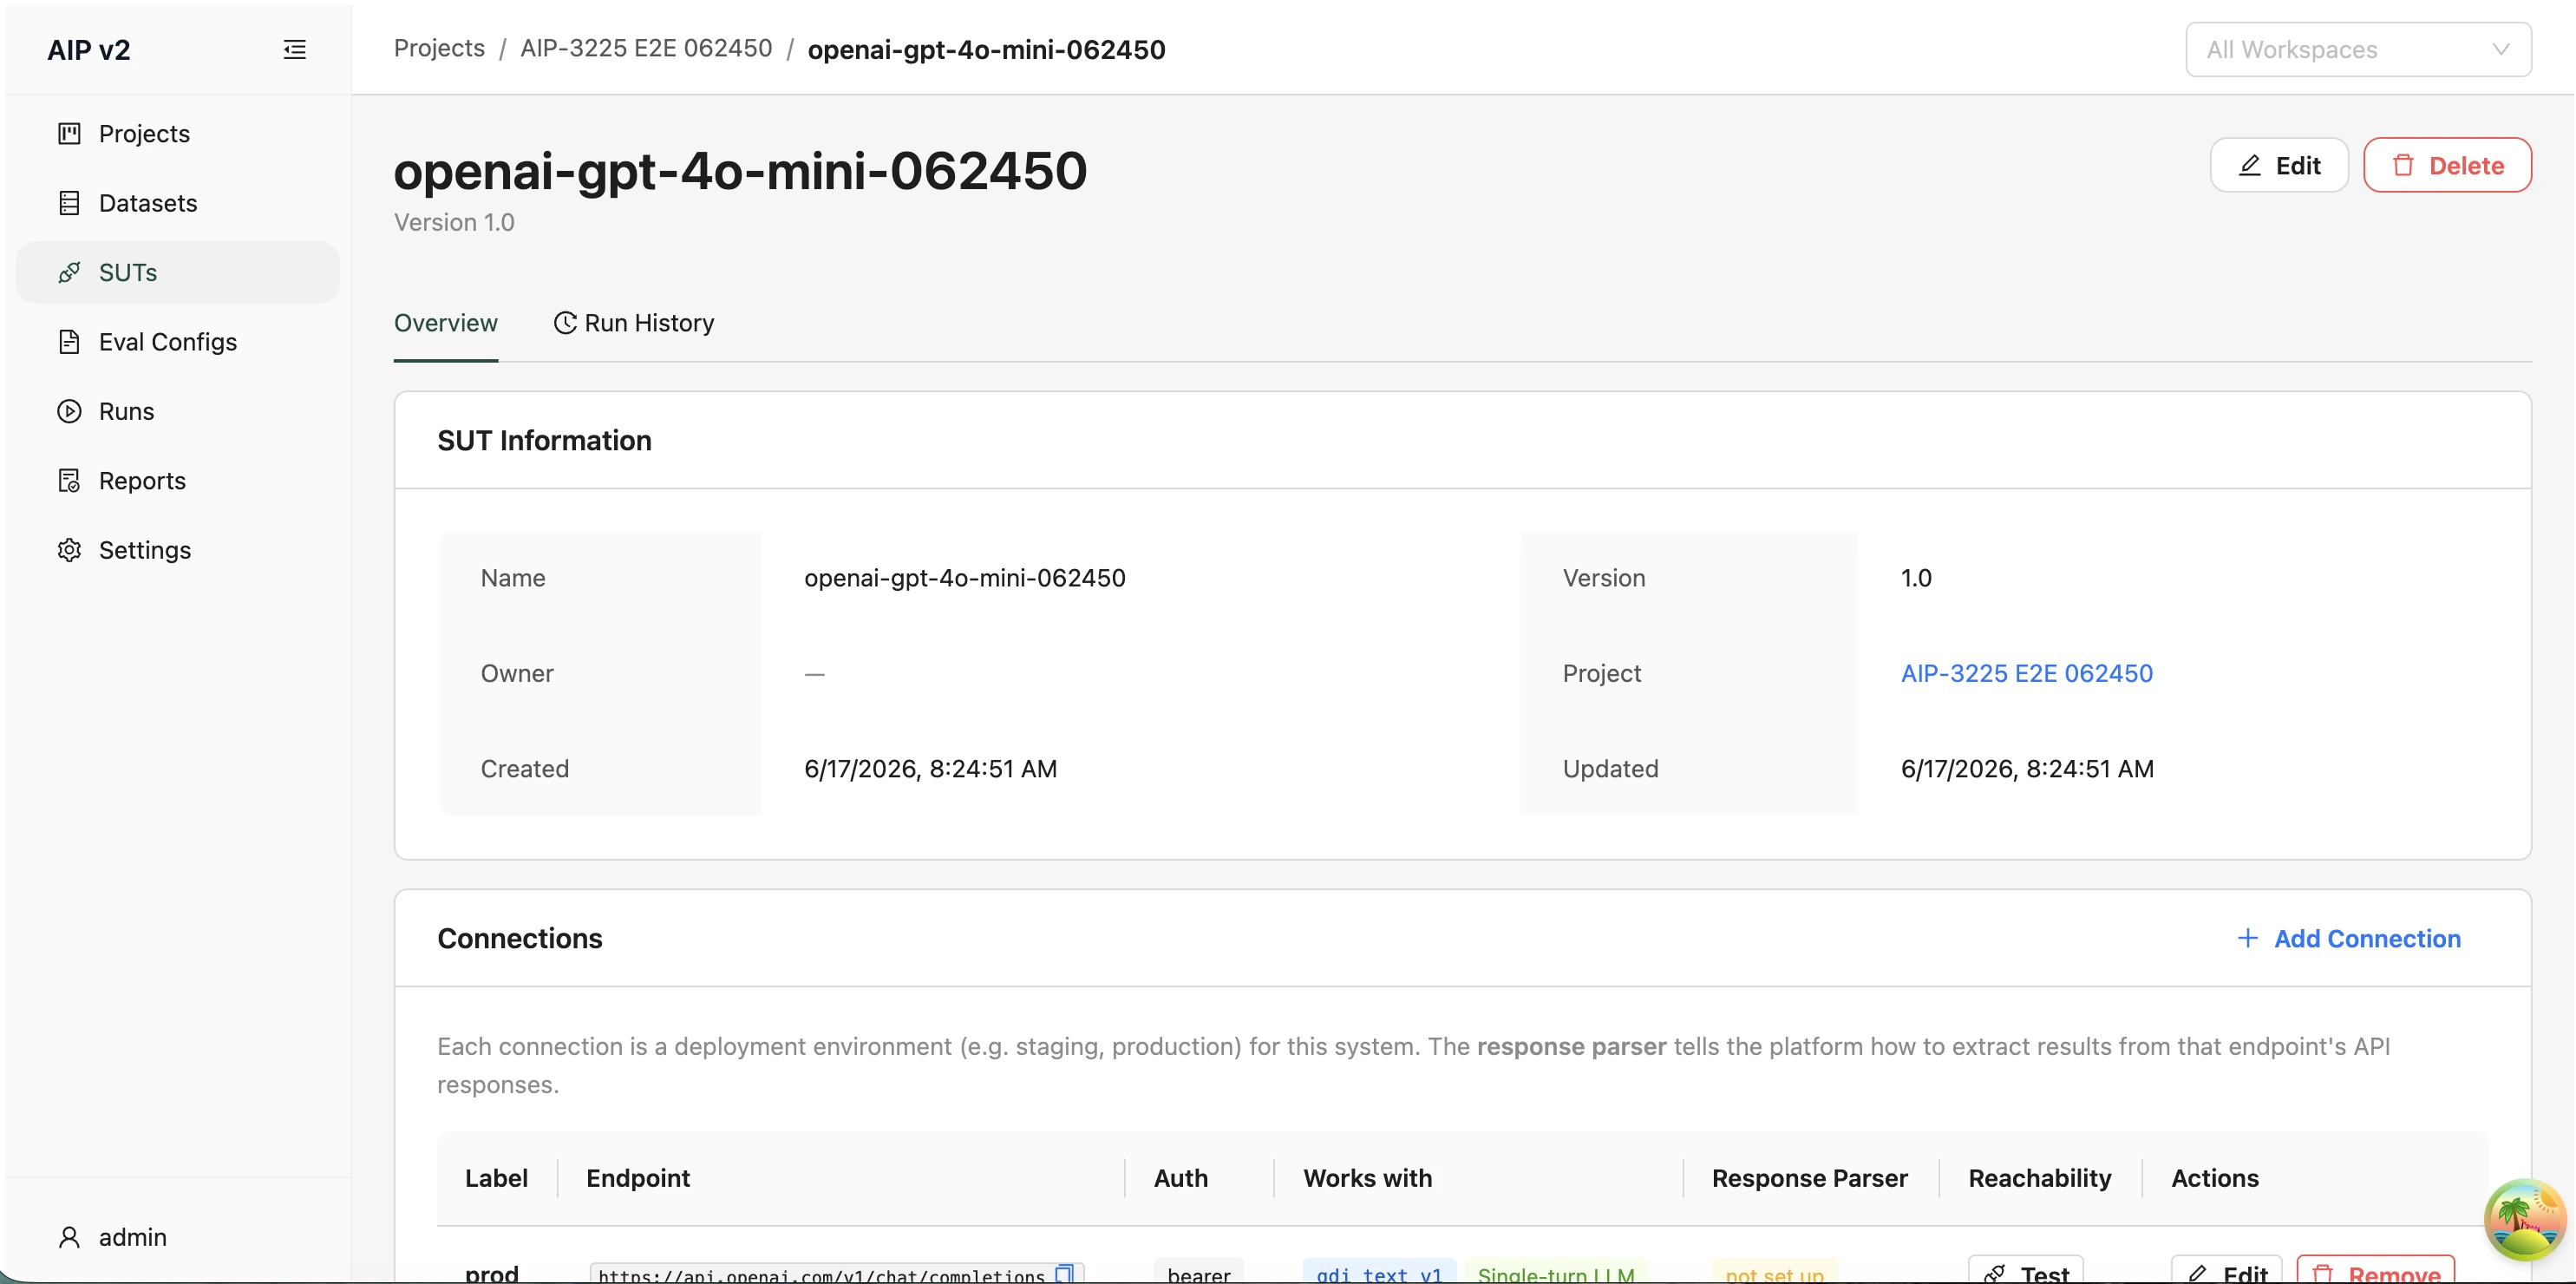
A Run History tab lists every evaluation run that used this SUT, with status and dataset version, linking through to the run.
🔗 Adding / Editing a Connection
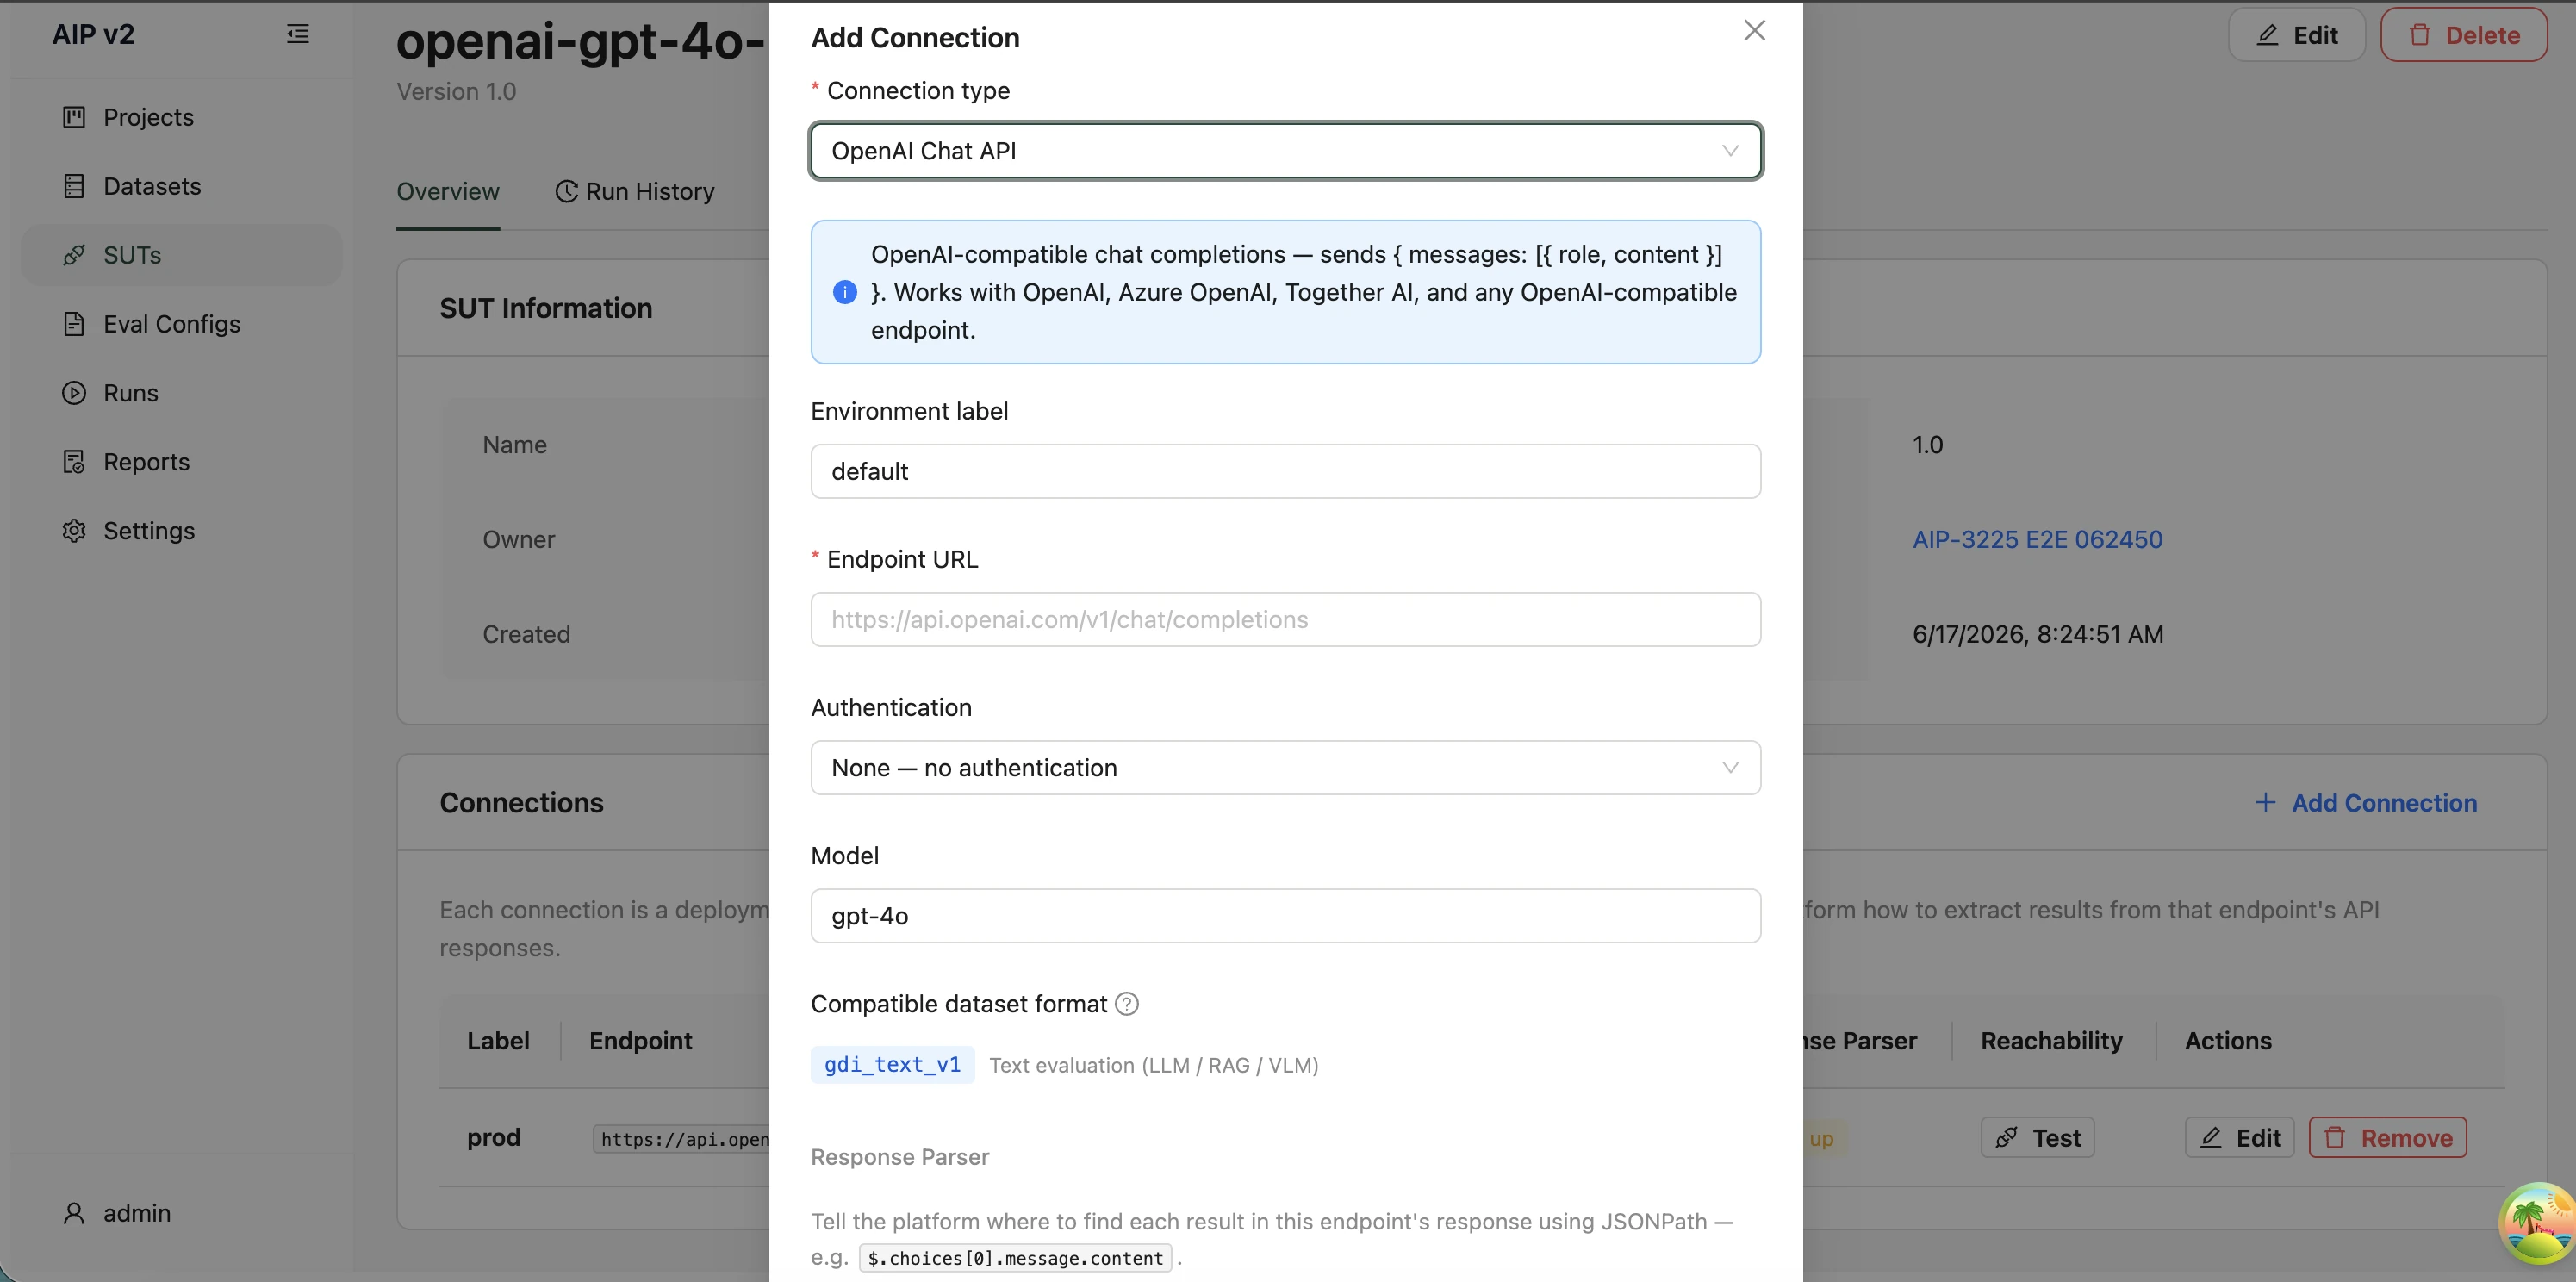
The connection modal configures one environment end-to-end:
- Connection type — pick the API format (e.g. OpenAI Chat, Anthropic Messages, Object Detection, or Custom). Known types pre-fill the schema, protocol, and parser defaults.
- Environment label —
default,production,staging, … - Endpoint URL — the URL the platform calls.
- Authentication —
none,bearer,api_key, orbasic. Secrets are entered as password fields, encrypted at rest, and never returned by the API (when editing, leave them blank to keep the existing credential). - Compatible dataset format — the GDI schema (and image task type) this connection produces; used to match compatible datasets when creating a run.
- Response Parser — tell the platform where each result lives in the response using JSONPath (e.g.
$.choices[0].message.content). A value nested deeper needs its full path —$.data.result.answer— see Supported JSONPath syntax for bracket notation, list indices, wildcards, and recursive descent. Known types show fixed fields; Custom lets you start from a built-in template or add field→path mappings by hand.
🩺 Testing a Connection (Live Health Check)
Each connection's reachability column has a Test button that fires a live request to the endpoint:
- ✅ a green Reachable tag (hover for latency + HTTP status), or
- ❌ a red Unreachable tag (hover for the error).
A re-test link re-runs the check.
SDK equivalent:
aip.sut.register(),sut.add_connection(),conn.set_adapter(), andconn.test(). See Systems under test.
📋 Test Plans
A test plan is a reusable evaluation methodology — the metrics and dimensions a project should be held to, published under a name and versioned. Plans are published via the SDK (aip.publish_test_plan()); the console is for browsing them and starting projects from them.
➡️ The Test Plans List
Open /test-plans. Each published plan is a card, newest first. Search plans by name or metric… filters by either, and the segmented control on the right narrows to one task type.
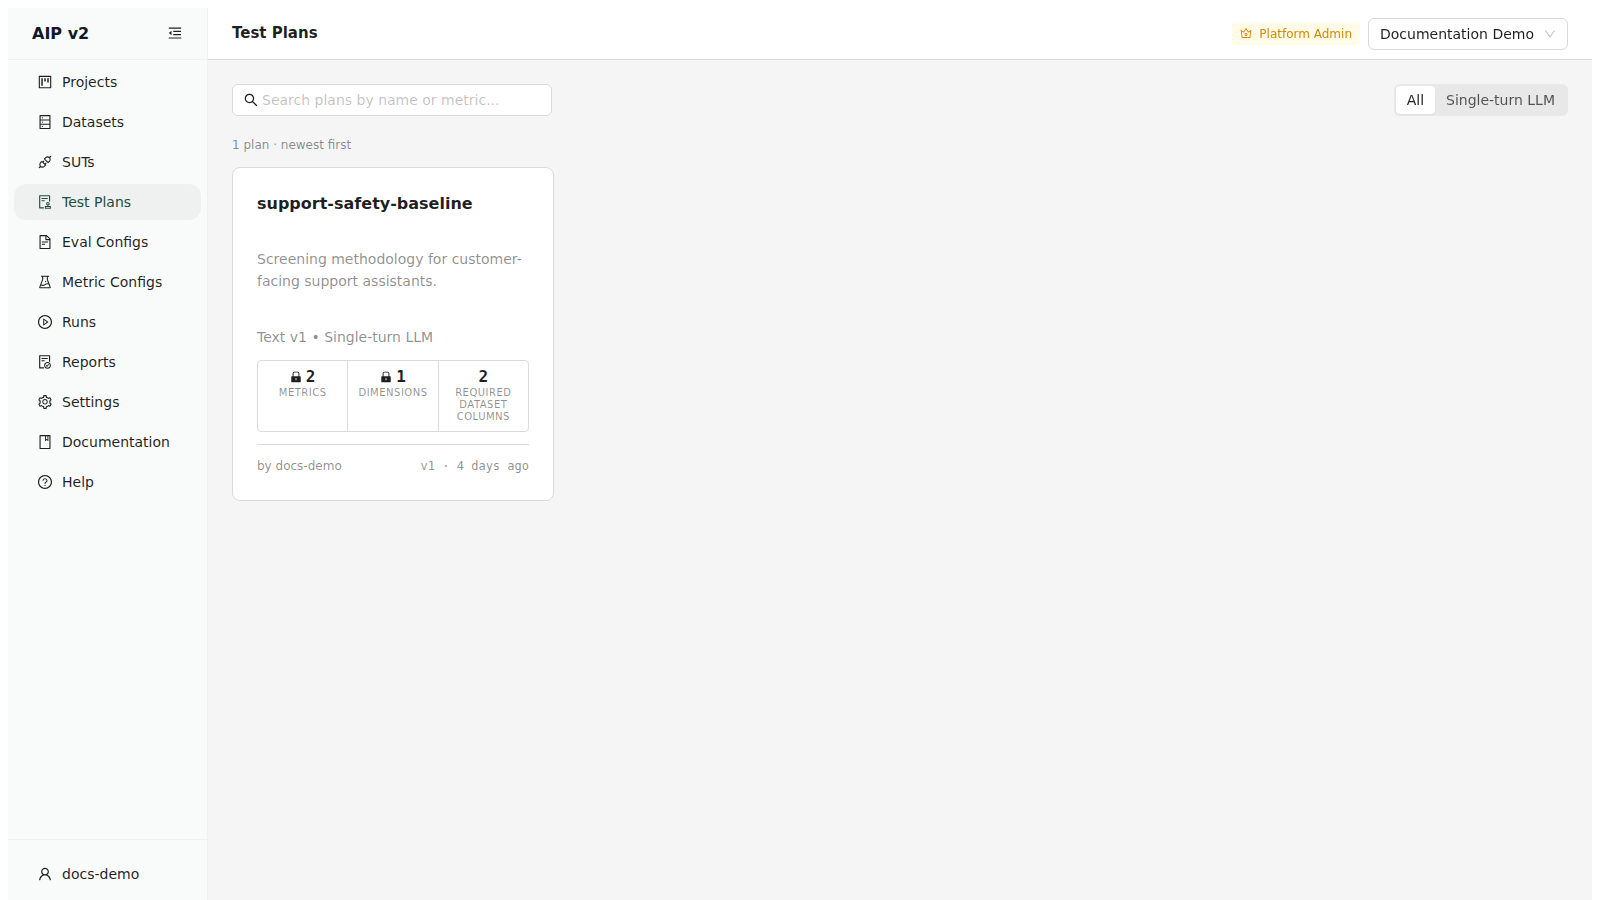
A card carries the plan's name and description, its schema and task type, and three counts: metrics, dimensions, and required dataset columns. A padlock on the first two means that tier is locked — a project bound to this plan cannot change it. The footer shows who published the version, which version it is, and how long ago.
There is no New Test Plan button. The empty state says so directly: "Plans are published via the SDK. Once one is published, it appears here."
📄 A Plan Version in Detail
Click a card to open one version. The version switcher (top-right) moves between published versions of the same plan; every version stays readable, so you can see what the methodology looked like before an edit.
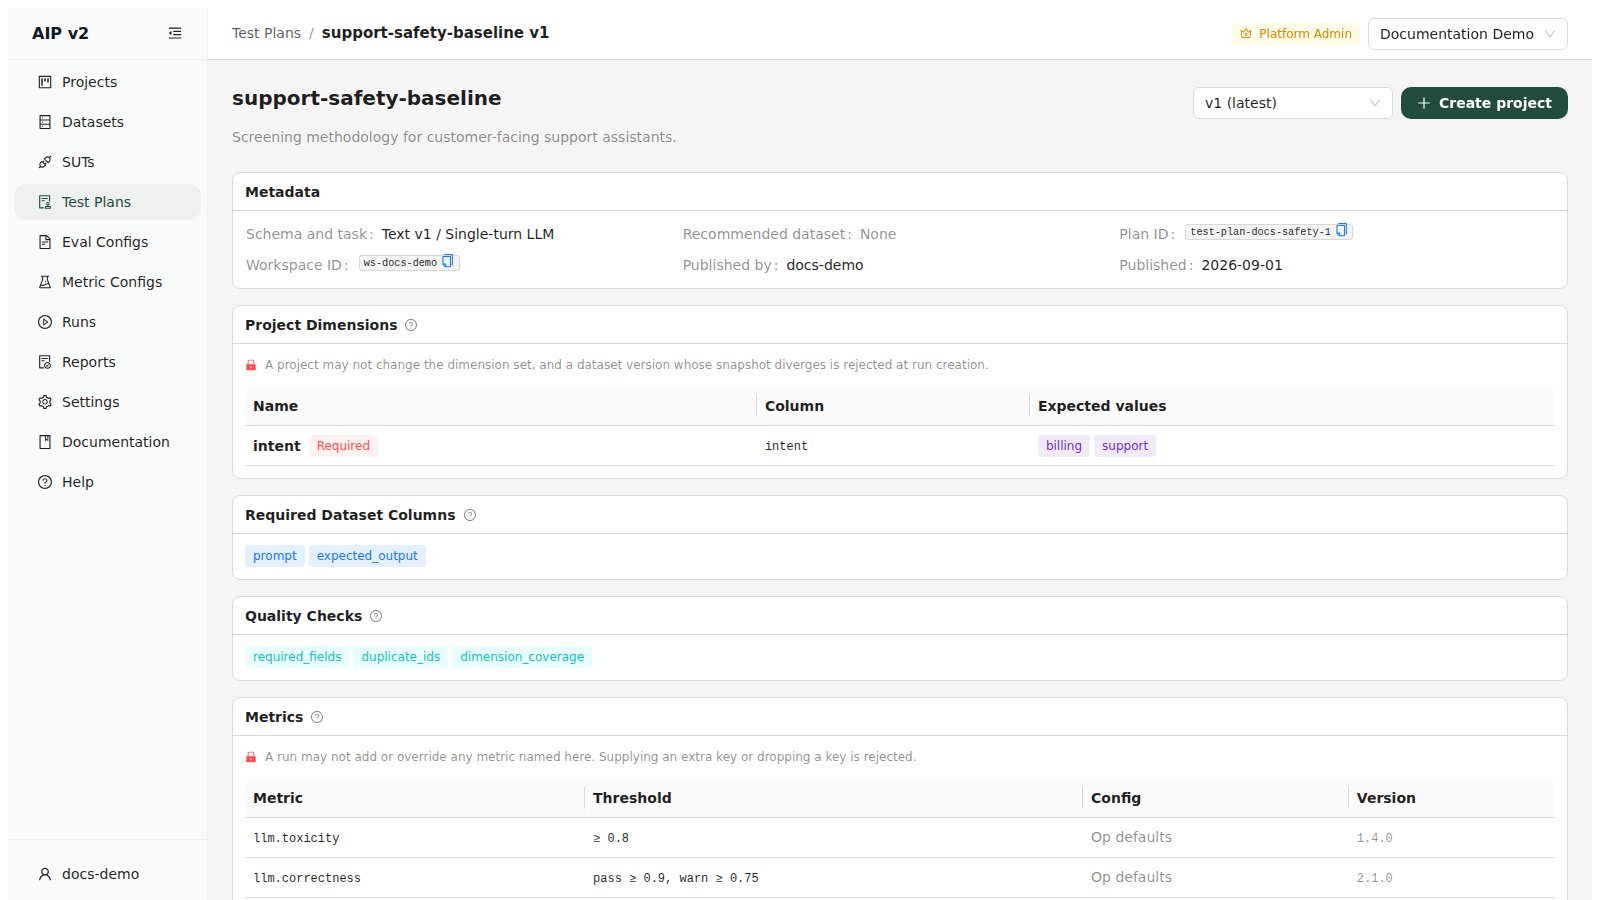
The page stacks five cards:
| Card | Shows |
|---|---|
| Metadata | Schema and task type, recommended dataset, plan ID, workspace, who published it and when |
| Project Dimensions | The dimension contract — name, column, and expected values |
| Required Dataset Columns | Every column this plan's metrics need in order to score |
| Quality Checks | The checks that will run against a dataset of this schema |
| Metrics | One row per metric, with its threshold, config source, and version |
Where a tier is locked, the card says what that means in place — the dimensions card warns that a project may not change the set and that a diverging dataset version is rejected at run creation; the metrics card warns that a run may not add or override any metric named here.
The counts can disagree: a card shows what the plan resolved to when it was published, while the detail page resolves the same metrics again as you read it.
✳️ Creating a Project from a Plan
Create project (top-right of the detail page) opens the New Project wizard already bound to the version you were reading, and pins it. Publishing a newer version of the plan later does not move that pin.
🔒 A Plan-Bound Project
Once a project is bound, every tab of its detail page carries a Test plan active notice naming the plan, its version, and which tiers it locks.
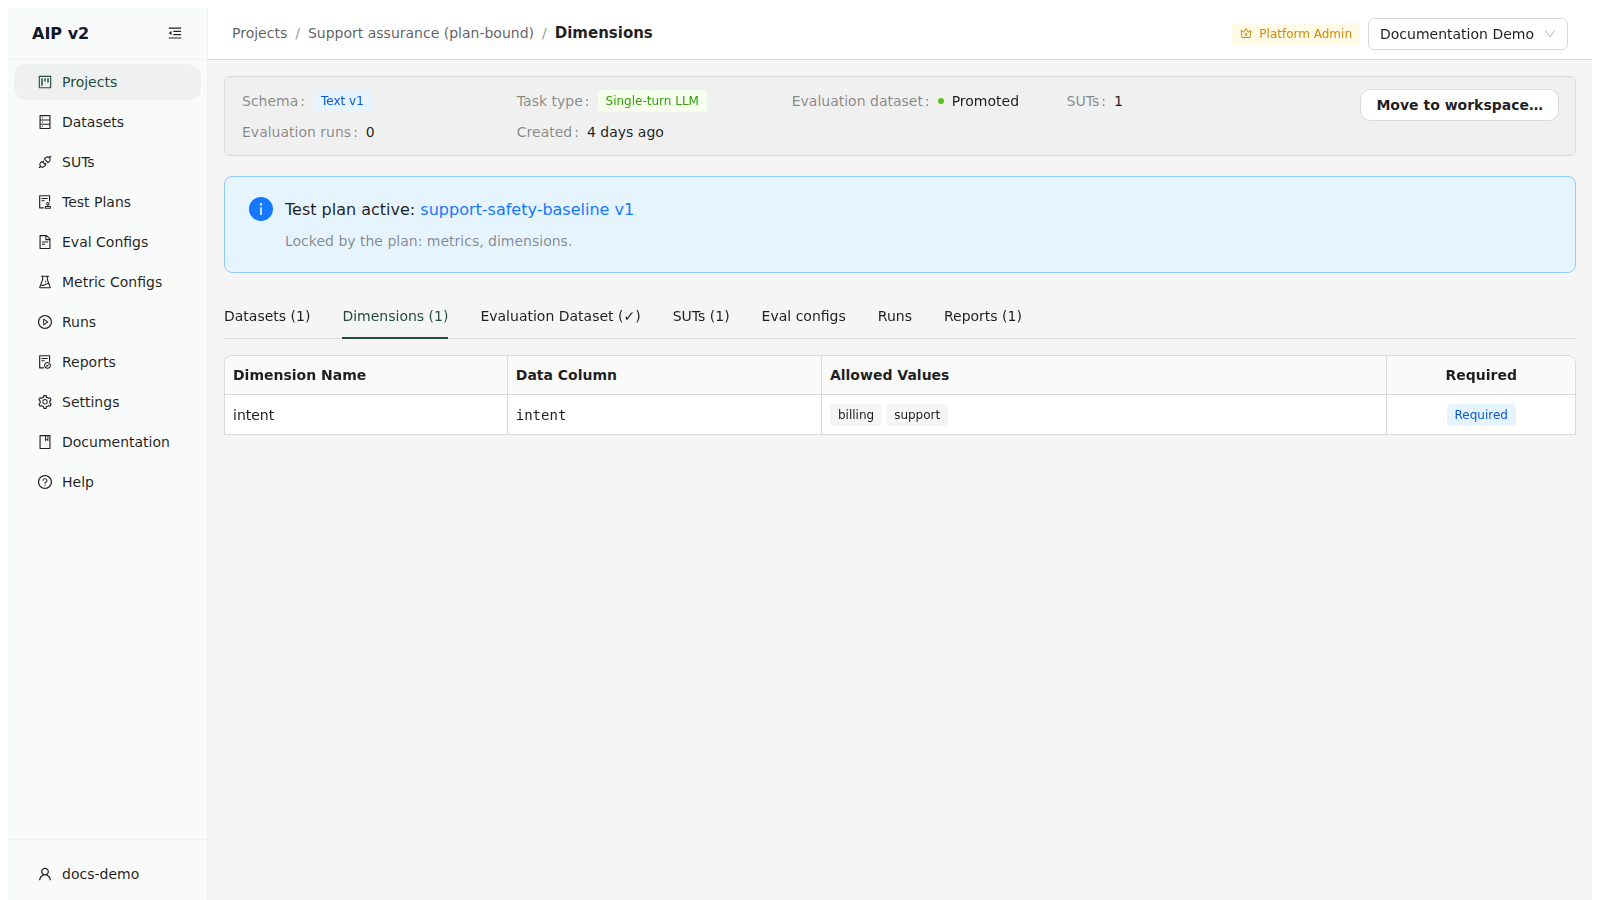
On the Dimensions tab that notice is the explanation for what is missing: the dimension set renders with no edit control, because the plan owns it. Under an unlocked dimension tier the same tab is editable as normal.
▶️ Launching a Run Under a Locked Plan
This is where a tester meets a test plan without having gone looking for one.
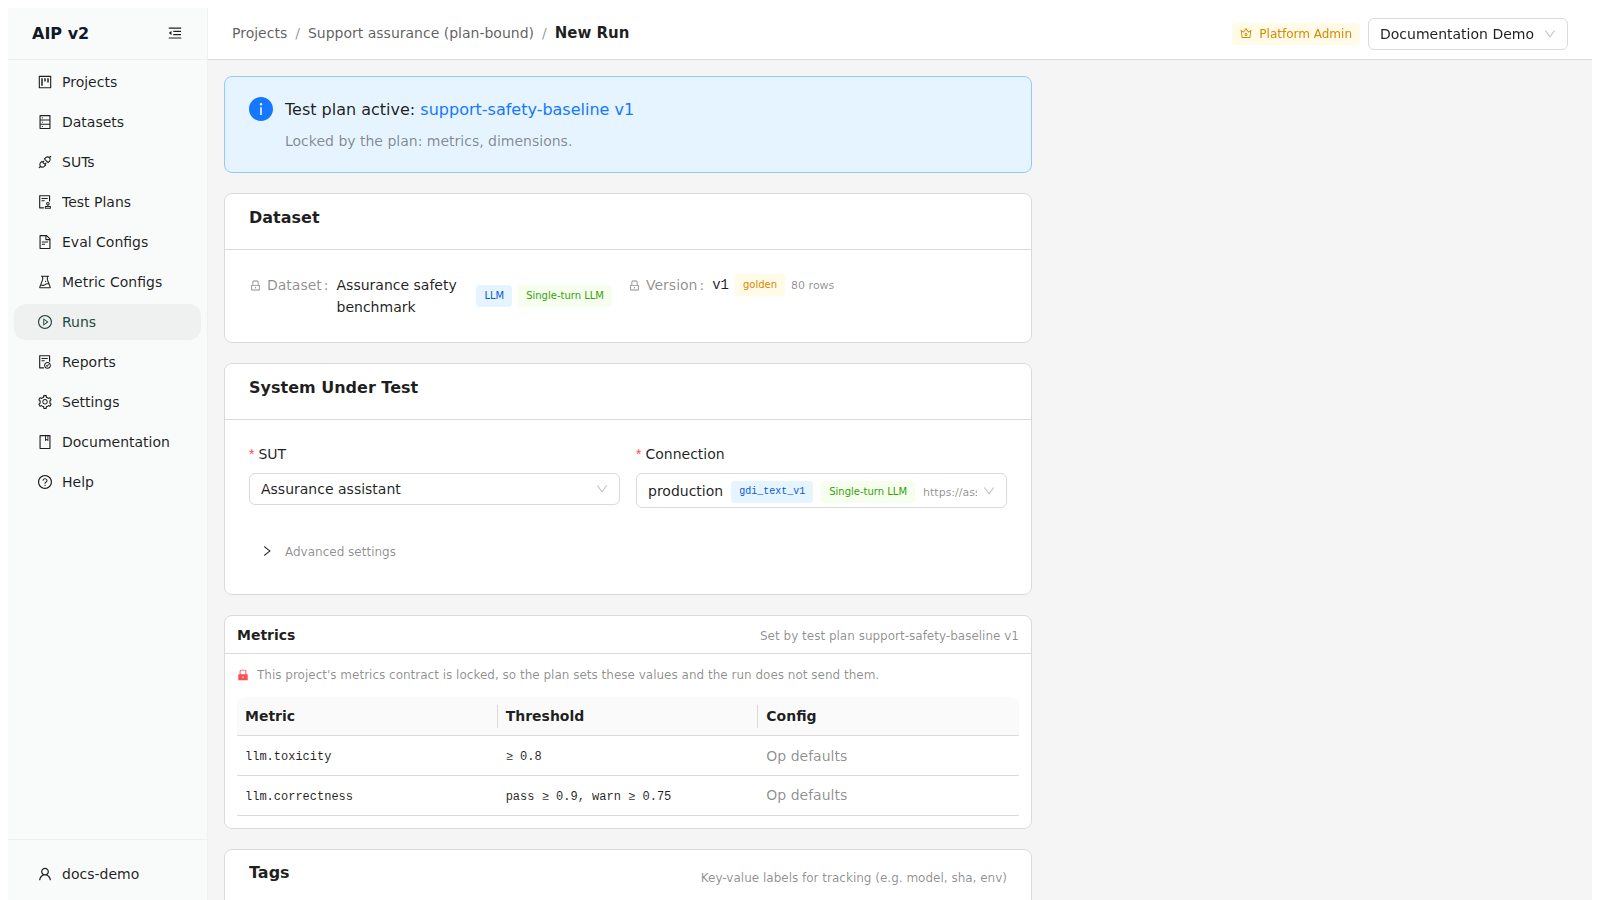
The Metrics panel is headed Set by test plan … and states the rule in place: "This project's metrics contract is locked, so the plan sets these values and the run does not send them." Each metric, its threshold, and its config source are listed read-only. The dataset and version are pinned too.
What stays editable is as informative as what does not. The SUT and Connection remain yours to choose, because the metrics lock governs the evaluation contract and nothing else — you decide what gets tested, the plan decides how it is scored.
SDK equivalent: browsing maps to
aip.list_test_plans()andaip.get_test_plan(); starting a project maps toaip.Project.create_from_test_plan(). Publishing a plan or a new version, and attaching, detaching or upgrading one on an existing project, have no UI.
🧩 Eval Configs
An eval config is a version-controllable YAML document that pins together a project, dataset, SUT, and scorers for a reproducible run. Configs are authored in code via the SDK: aip.save_eval_config(config, path) writes local YAML and aip.publish_config(config, name, workspace_id=...) publishes it to the platform. The UI is for browsing, editing, and managing published configs.
➡️ The Eval Configs List
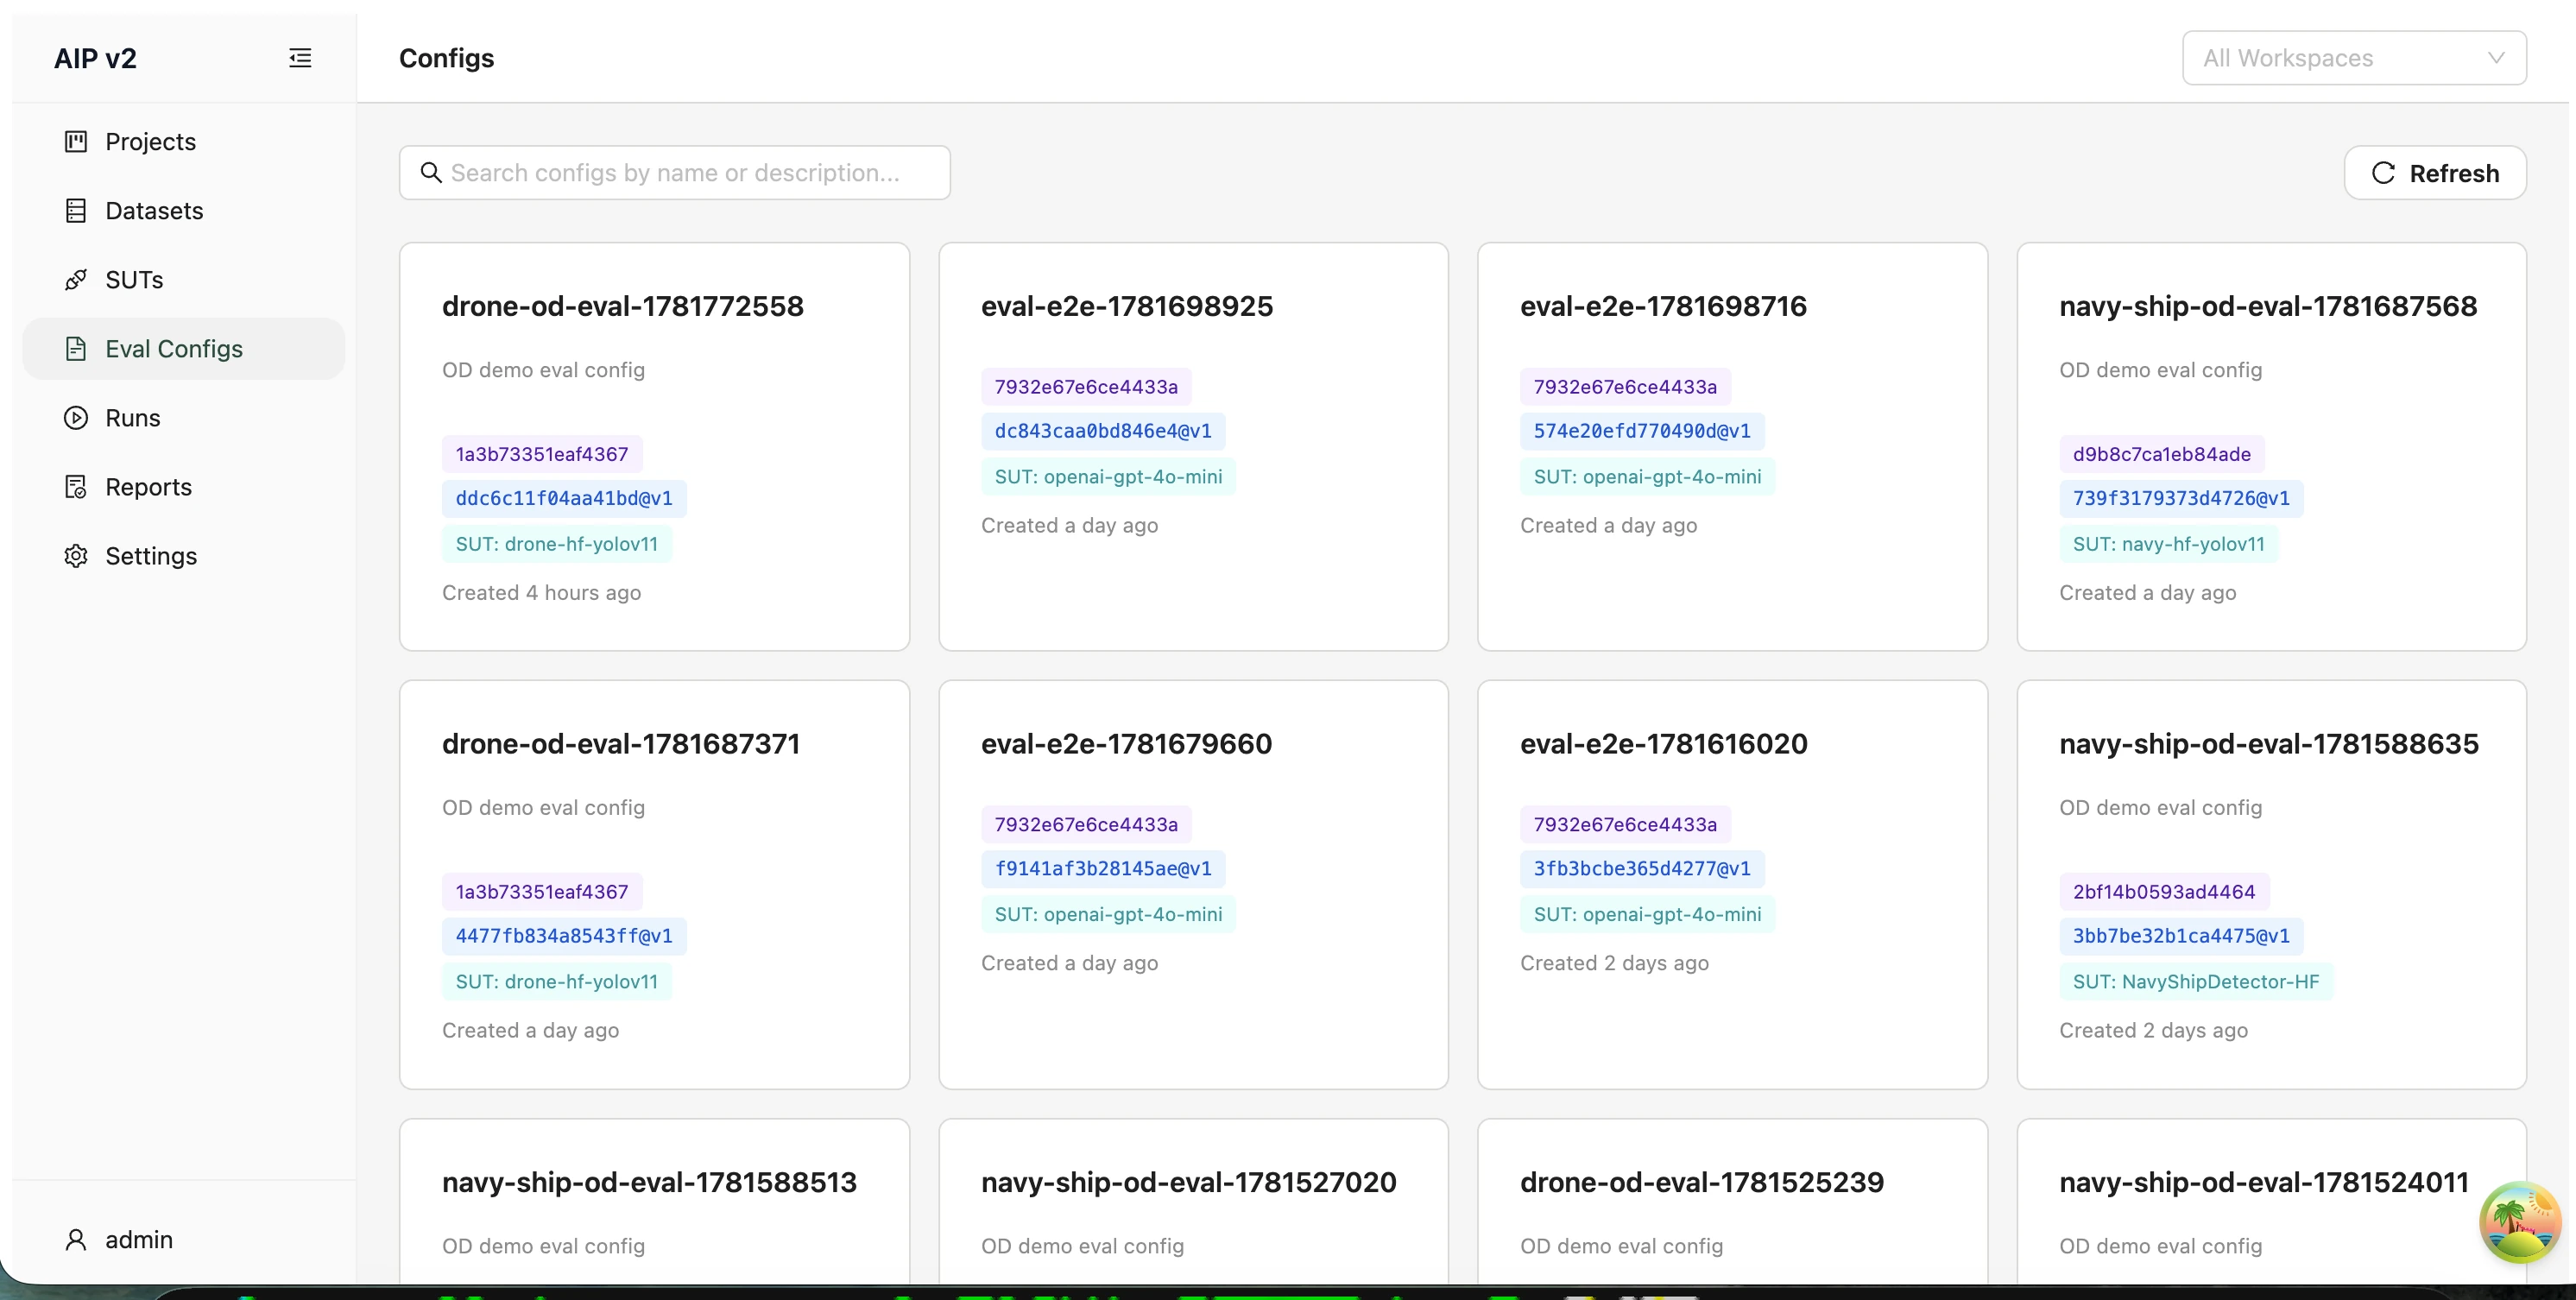
Open /eval-configs. Each saved config is a card showing its name, description, and linked dataset/SUT. Search configs by name or description… filters the list. There is no "create" button here — the empty state points you to the SDK, since configs are typically written alongside your evaluation code.
📄 Viewing & Editing a Config
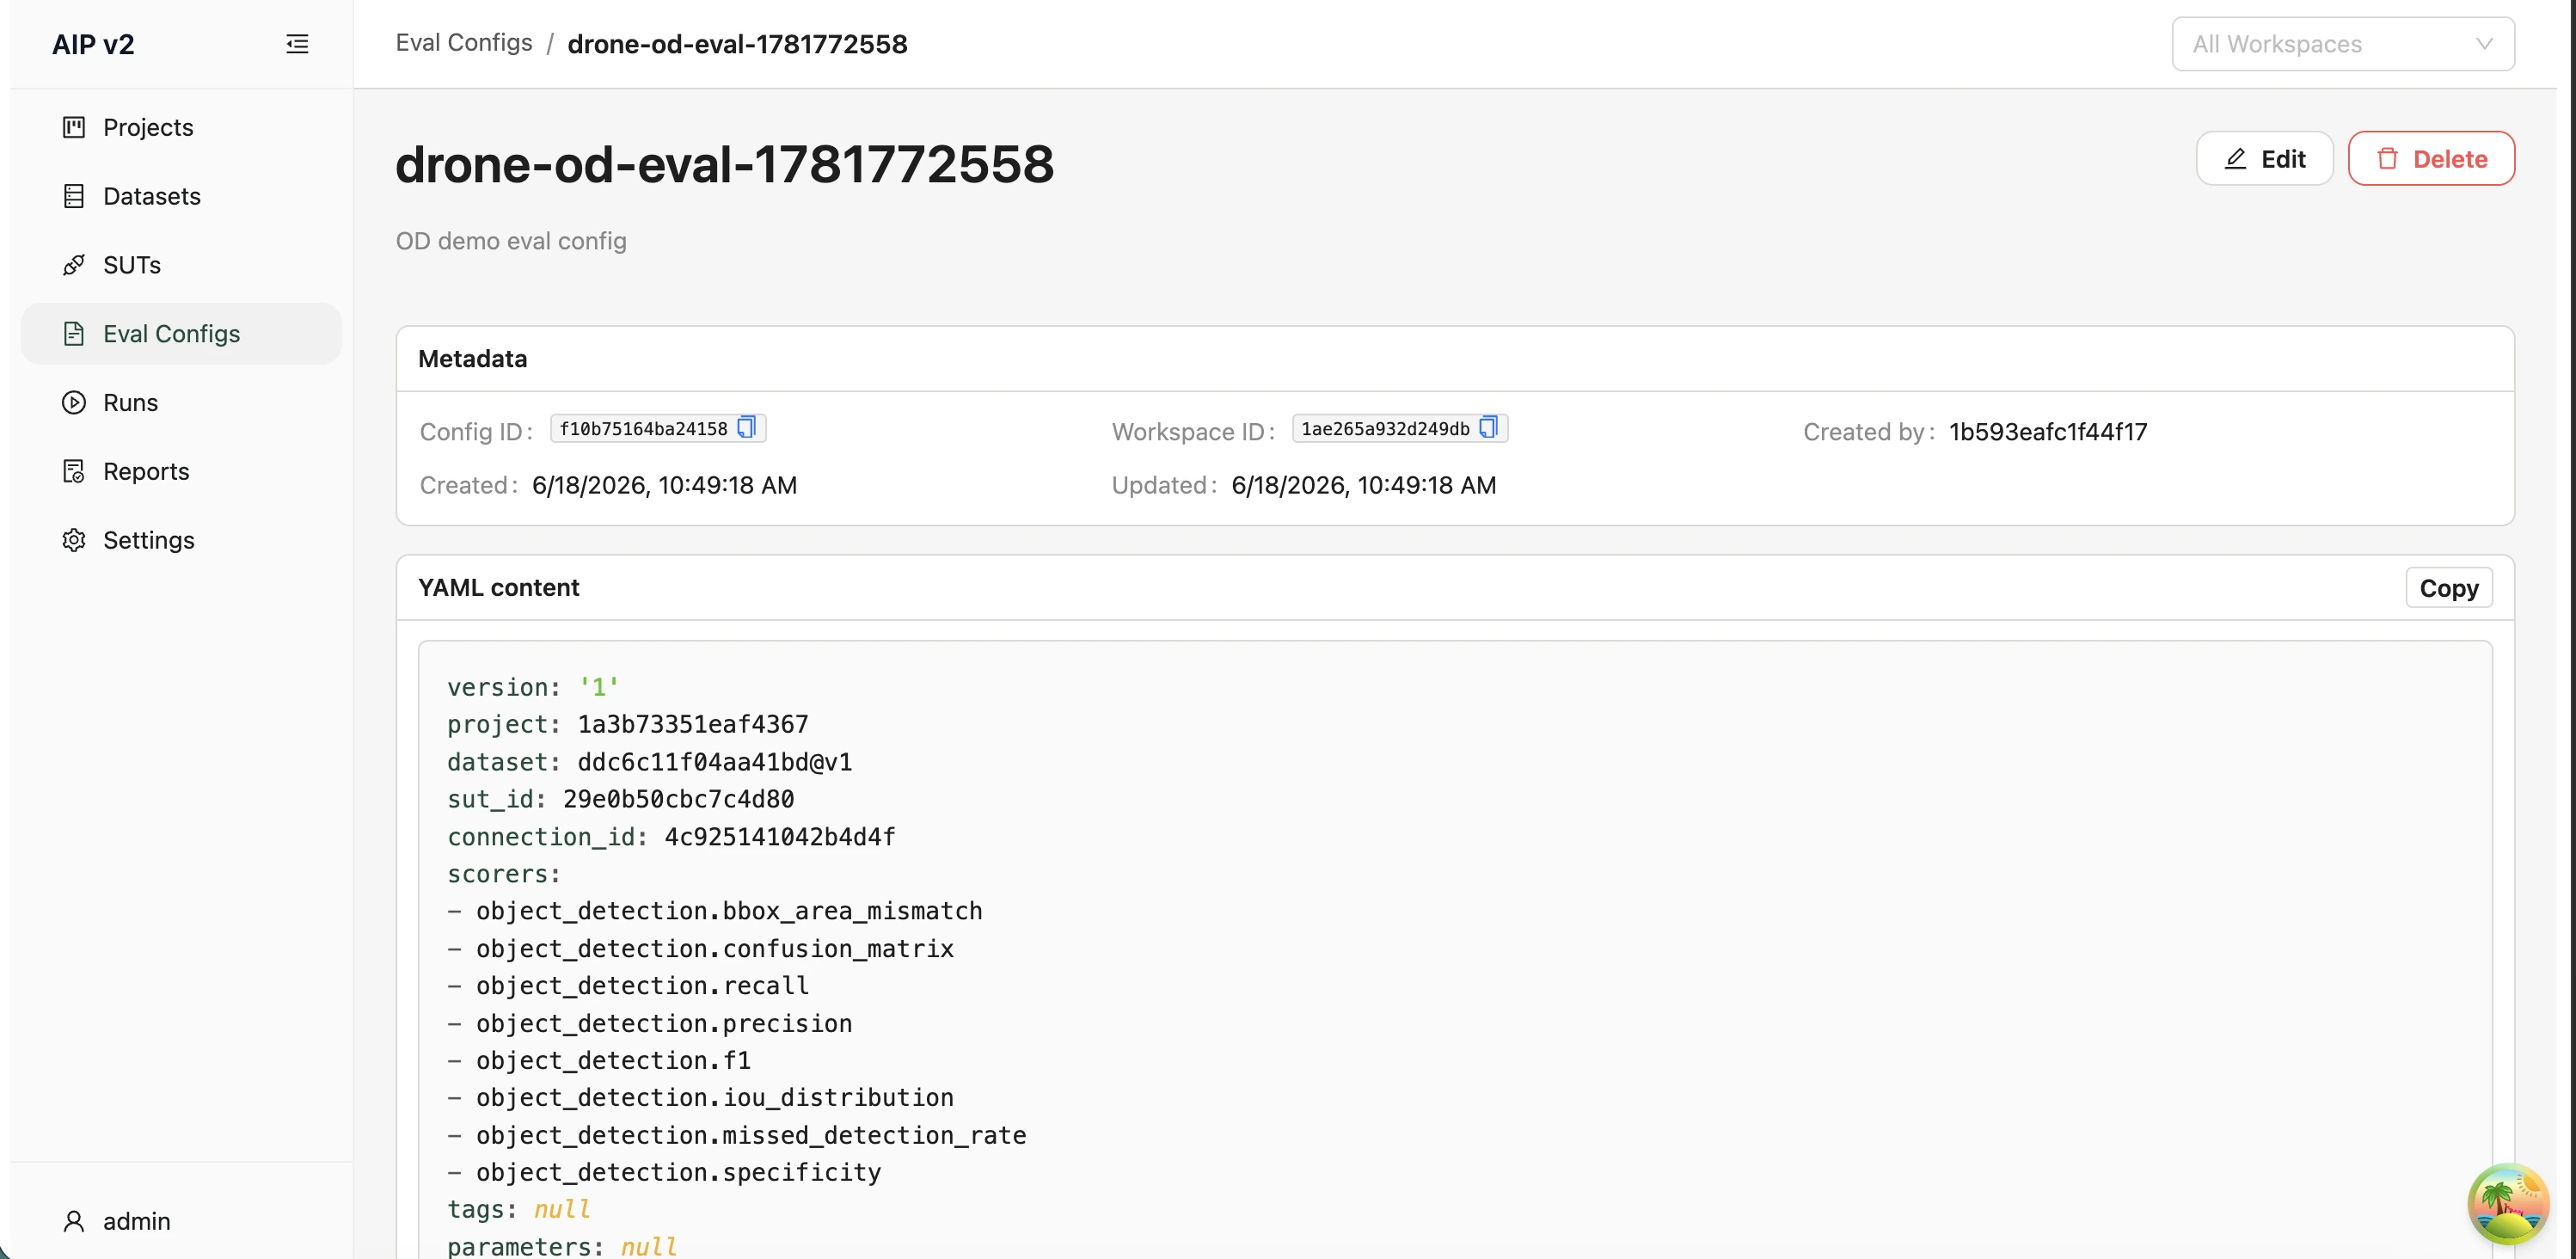
The detail page renders the config's YAML with light syntax highlighting, plus a metadata card. The action bar offers:
- Edit — swaps the YAML into an editable text area; Save issues an update and surfaces server-side validation errors (422) inline. Cancel discards the draft.
- Delete — soft-deletes the config (it's excluded from all future reads) and returns you to the list.
- Copy — copies the raw YAML to your clipboard.
Any unknown or deprecated fields in the content are listed with a warning so they're never silently dropped from the UI.
SDK equivalent:
aip.save_eval_config(config, path)for local YAML andaip.publish_config(config, name, workspace_id=...)for platform publication. See Evaluation configs.
▶️ Launching an Evaluation Run
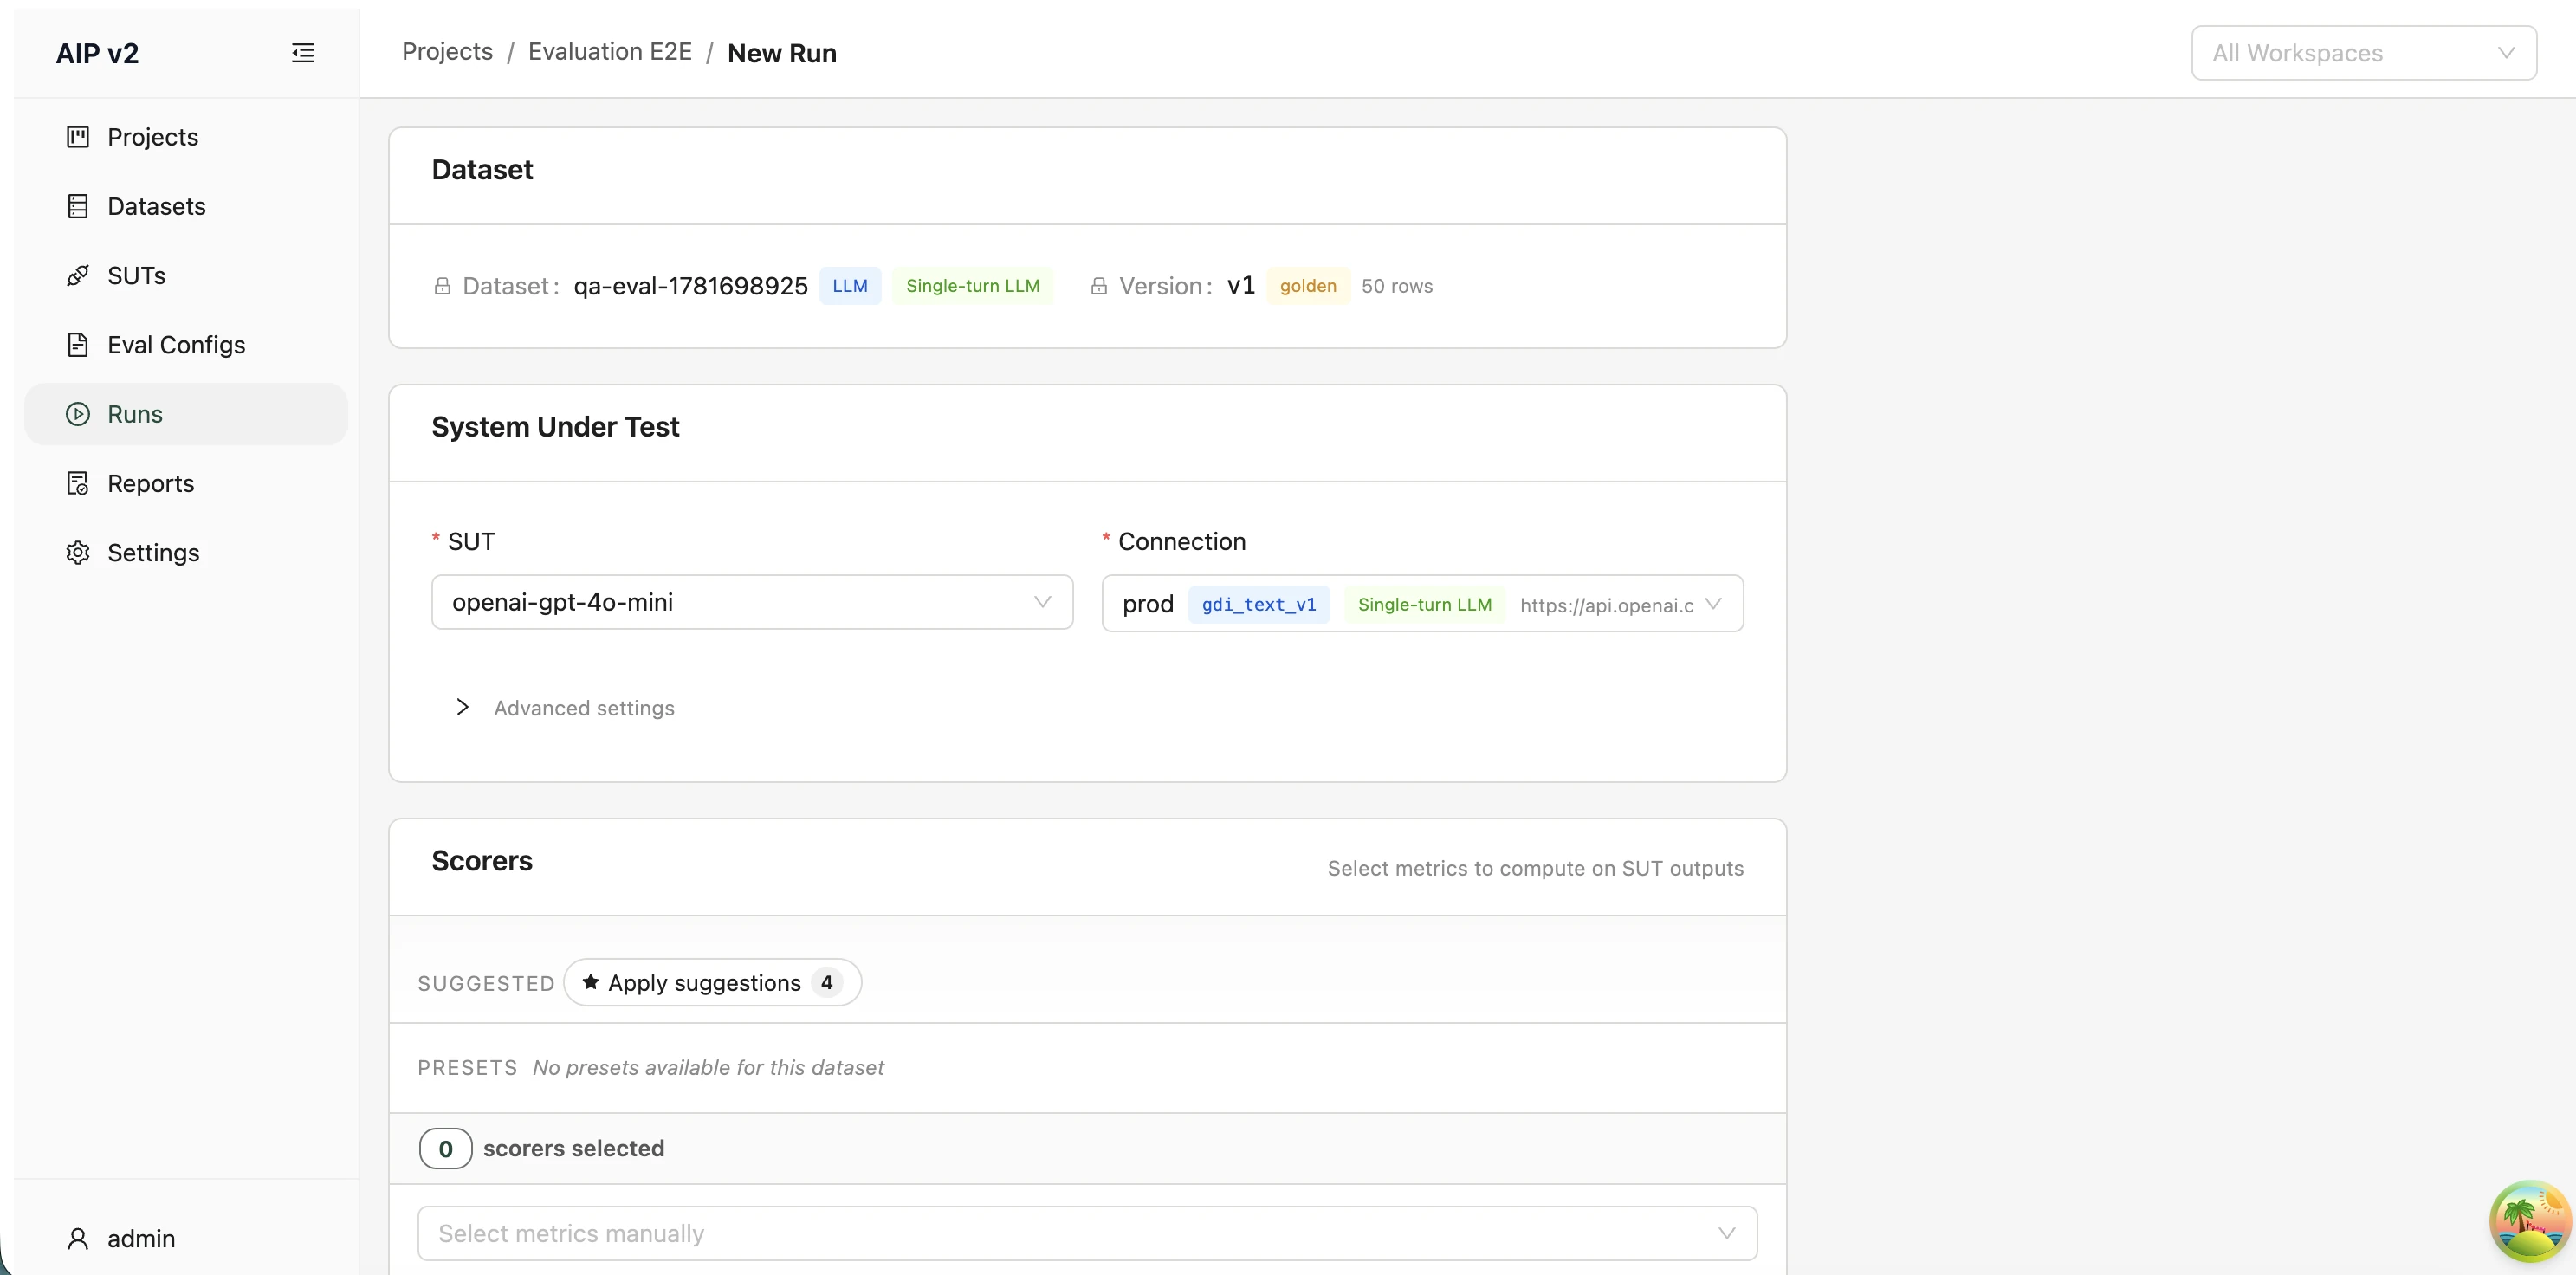
The New Run page configures and launches a hosted evaluation — the platform calls your SUT for every row of the golden dataset and scores the outputs. Reach it from a project's Runs tab (or the Runs list) via New Run; launching from a project pre-fills and locks the dataset and version.
The page is four cards, top to bottom:
1️⃣ Dataset
Pick the dataset and version to evaluate against. In project context these are locked (🔒) to the project's golden version; otherwise pick a dataset (schema/task tags shown, searchable) and a version — the golden version is auto-selected.
2️⃣ System Under Test
Choose the SUT and one of its connections. Only connections compatible with the dataset's schema/task are listed; if none match, a warning explains what's needed (and if the project has no SUT at all, you're nudged to register one first). An Advanced settings section exposes Batch size (default 20), Concurrency (5), and Timeout (5000 ms).
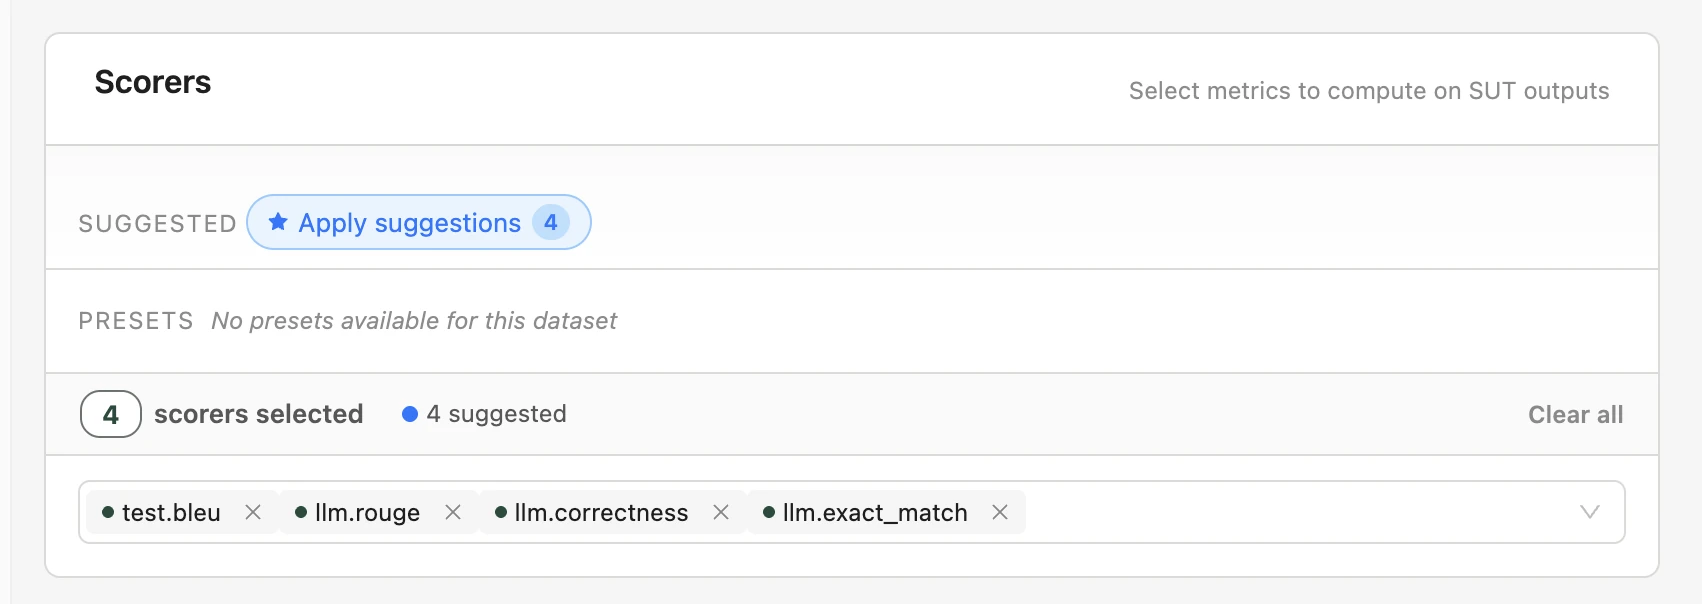
3️⃣ Scorers
Pick the metrics to compute on the SUT outputs ("Select at least one scorer" is enforced). Three aids speed this up:
- Suggested — a chip that toggles the metrics the platform recommends for this dataset (with a count). Metrics with no runnable scorer are shown as "N skipped (not runnable)" with a hover list.
- Presets — one-click chips that apply a saved bundle of scorers (or "No presets available for this dataset").
- Scorer list — the full catalogue, filtered to the scorers valid for the dataset's schema/family; expand a scorer to set its config.
4️⃣ Tags
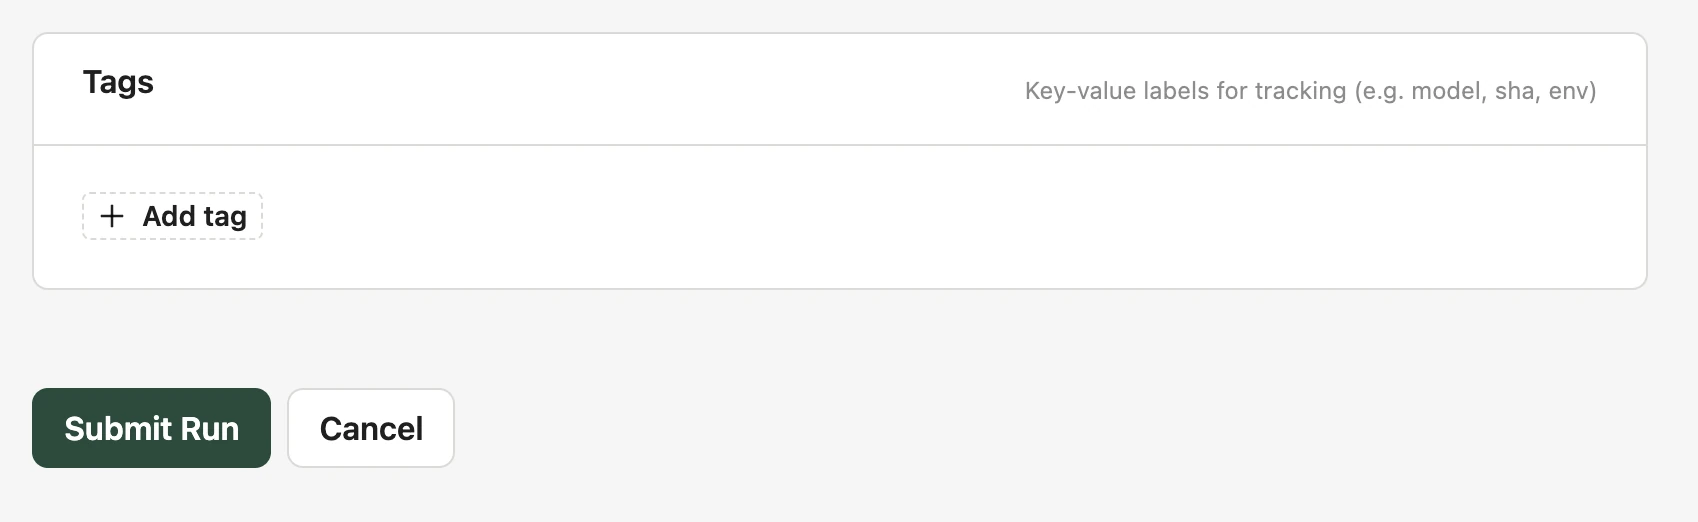
Optional key-value labels for tracking (e.g. model=gpt-4o, sha=…, env=ci). Add tag appends a row.
Click Submit Run to enqueue the evaluation — you're taken straight to the new run's detail page. Submission errors surface inline.
SDK equivalent:
aip.run(...)/aip.arun(...)(hosted runner whenconnection_idis passed;sut_idis attribution-only). See Evaluation runs.
🏃 Runs — List & Detail
The project Runs tab shows evaluations for the selected project.
➡️ The Runs List
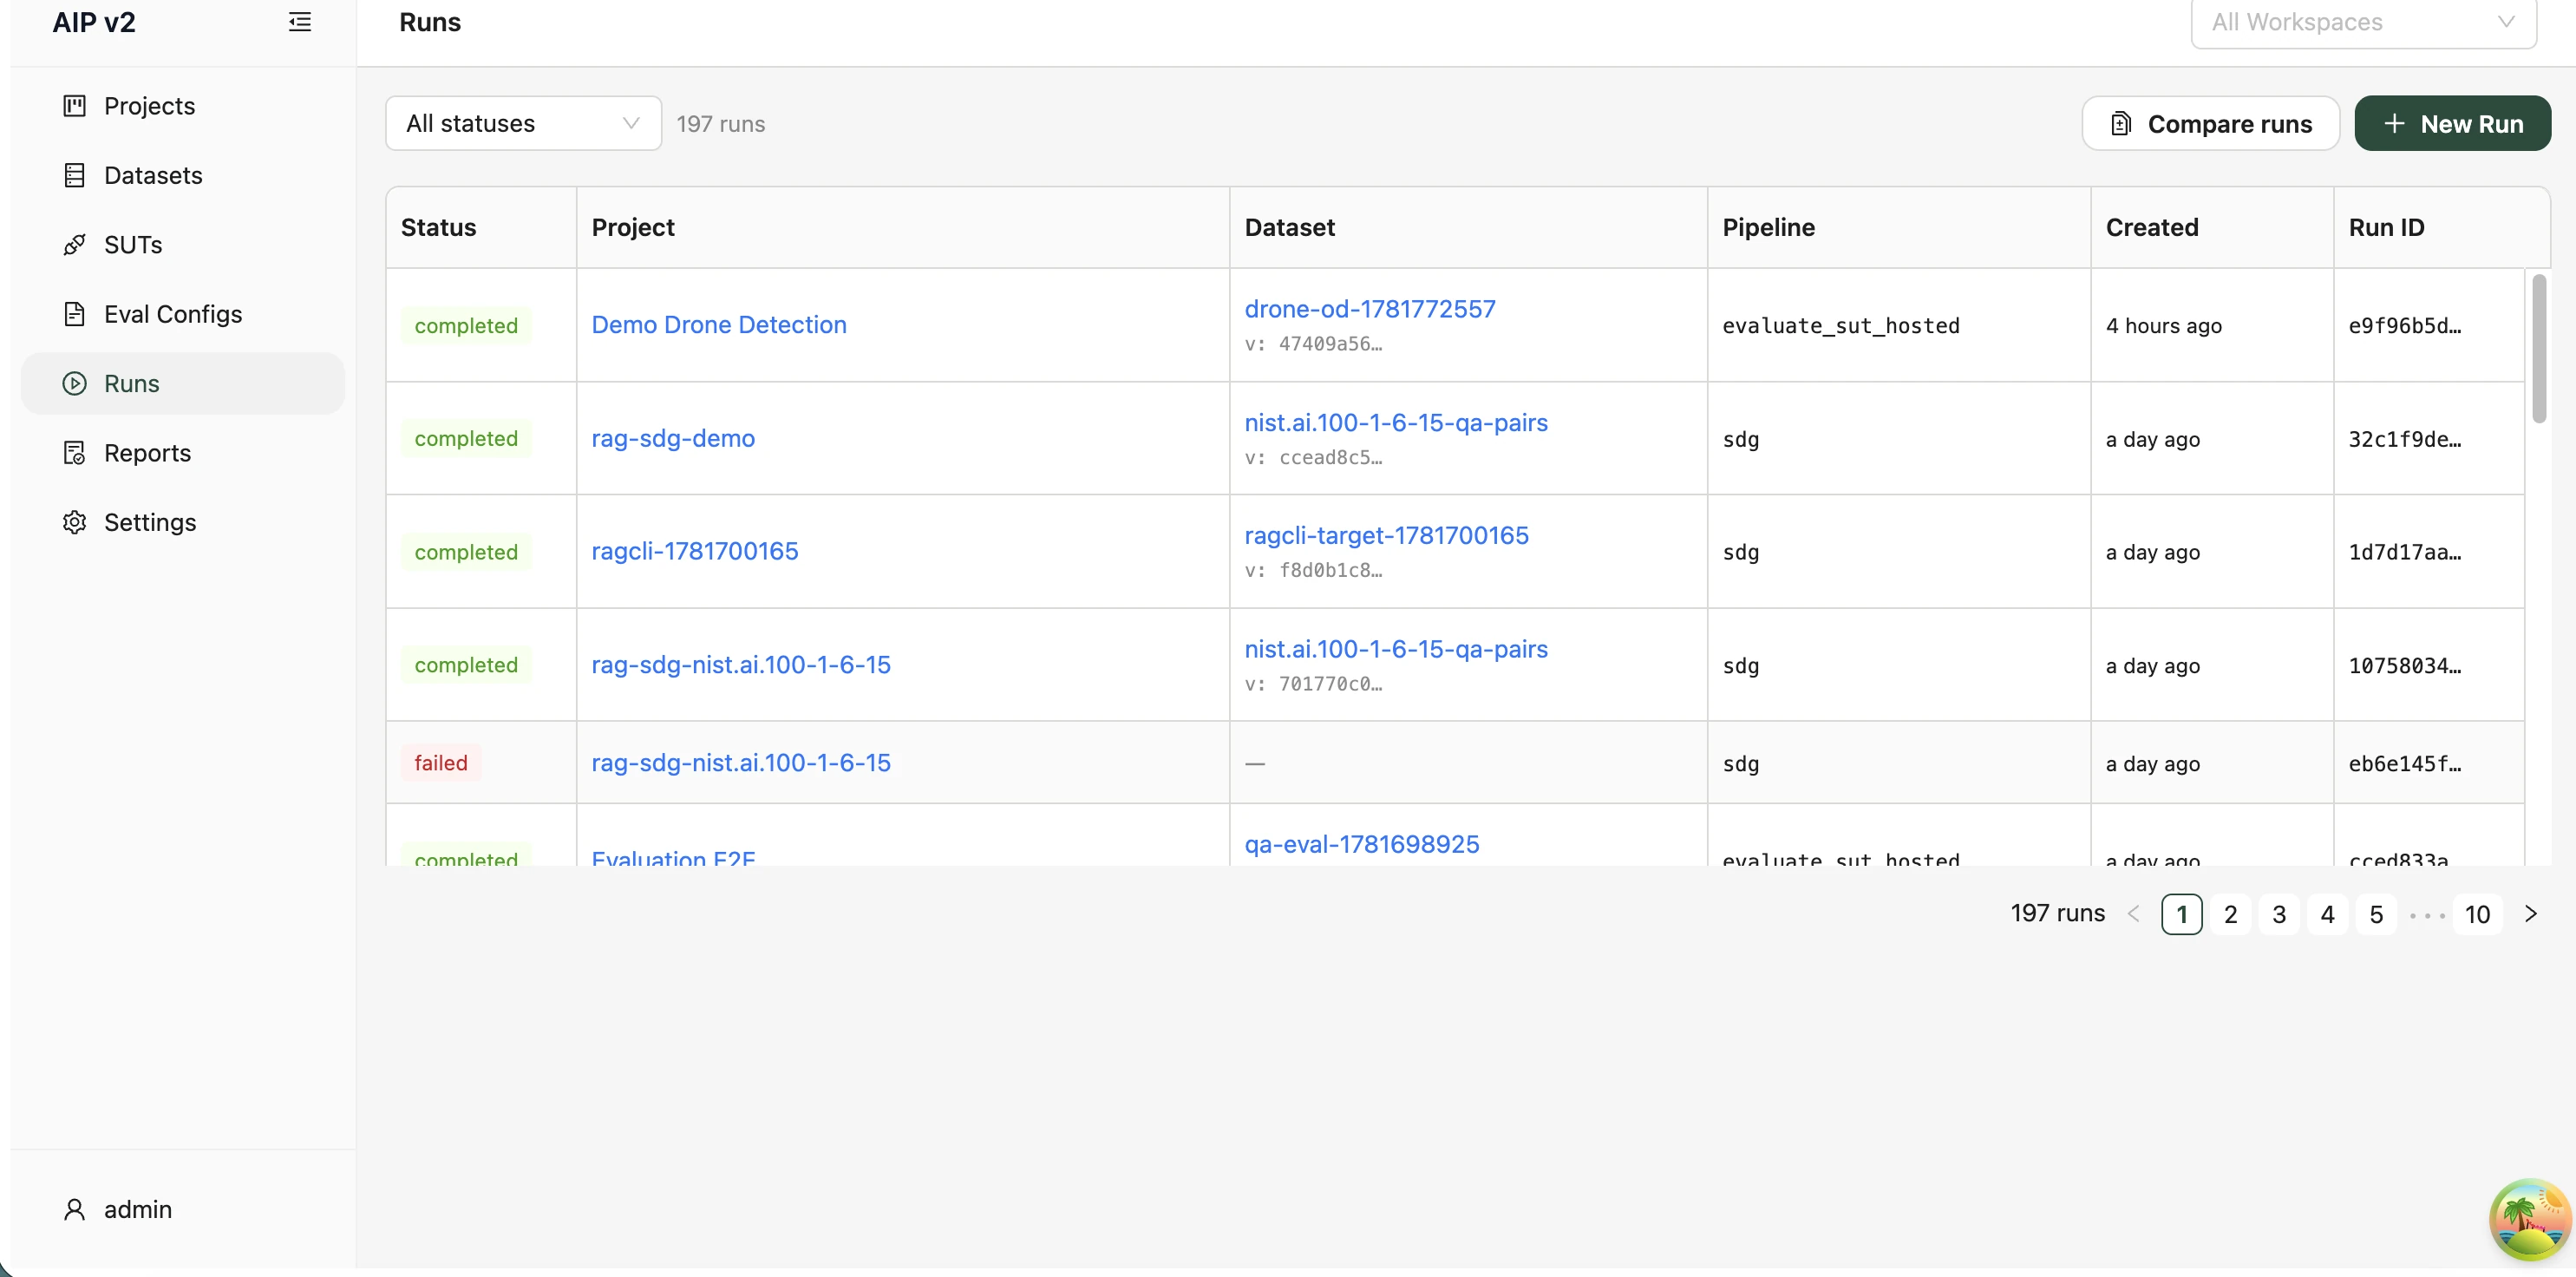
Open /runs. The table lists every run with its Status, Project, Dataset (+ version), Pipeline, Created time, and Run ID — project, dataset, and run ID are click-through links. A status filter narrows the list (pending / running / completed / failed / cancelled) and the count updates. Use New Run in the toolbar to launch an evaluation. Run comparison starts from a project's Runs tab so the candidate pair stays in project context.
📄 The Run Detail Page
Clicking a run opens its detail page. The header summarises Status, Project, Dataset, Mode (hosted or external), Created, Run ID, the detected Dimensions, the Scorers that ran, the SUT, and any Tags. Running runs auto-refresh until they reach a terminal state. Three tabs follow: Overview, Explore, and Clusters.
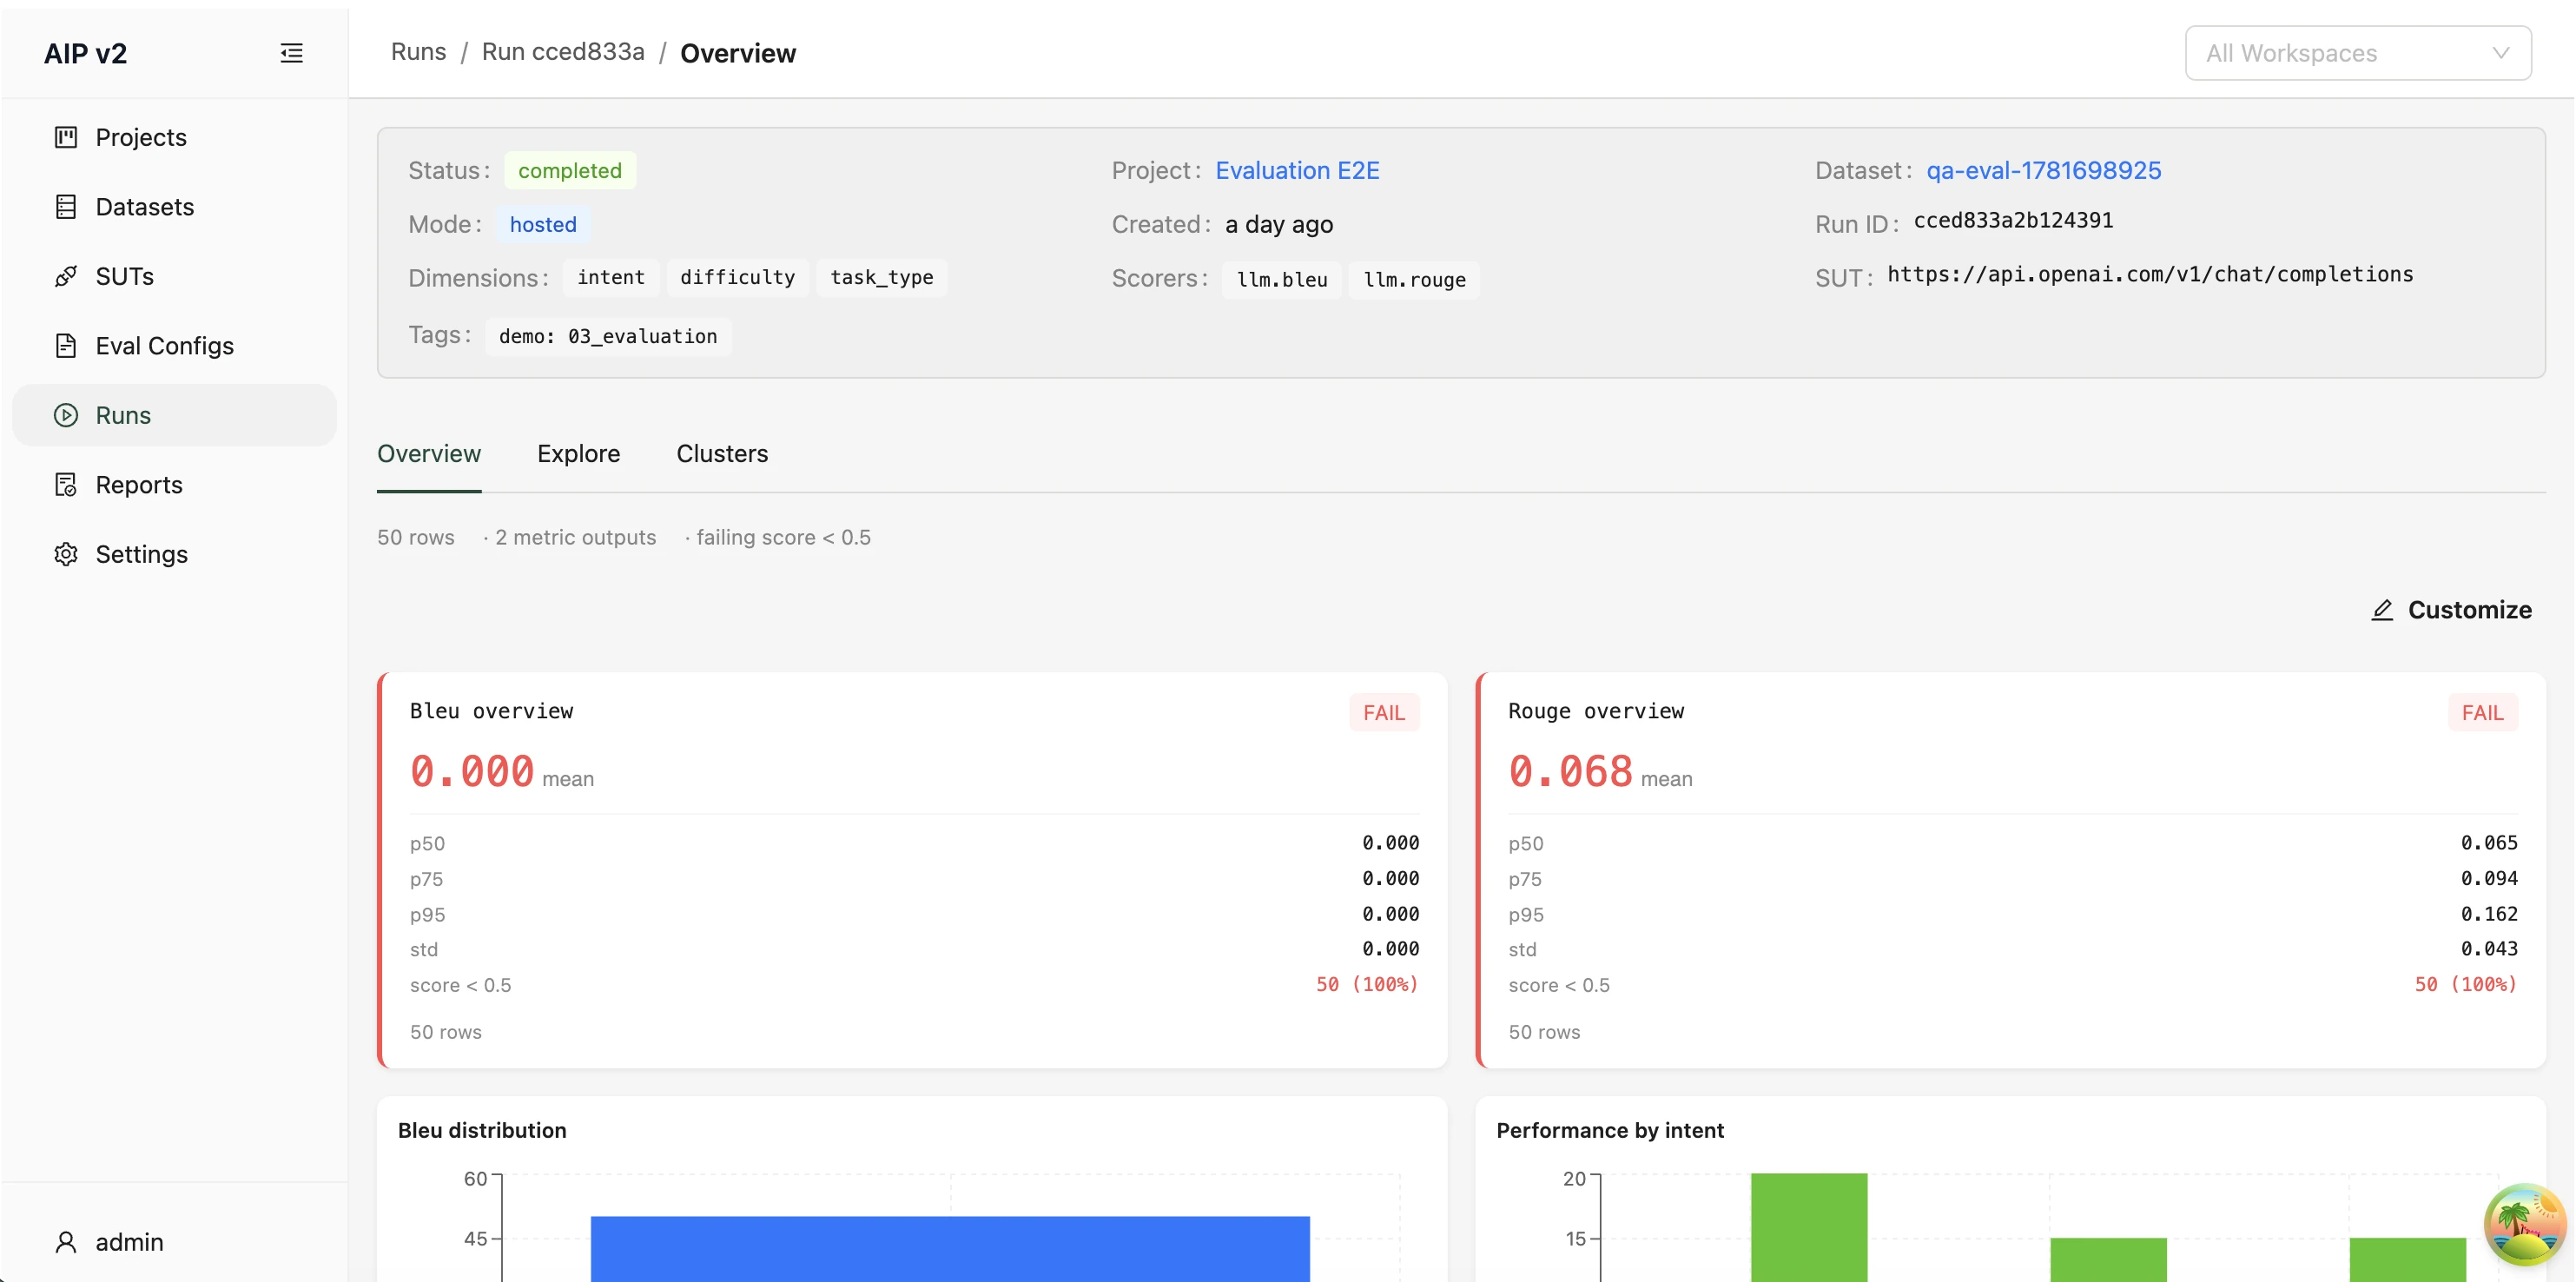
📊 Overview Tab (Dashboard)
The Overview tab is a configurable dashboard (available once the run has completed — otherwise it shows "Dashboard is available once the run has completed."). It opens with an analysis summary strip (row count · metric outputs · dimensions) and a set of default widgets derived from the run's analysis — e.g. Group performance (mean scorer per dimension group), Failure breakdown, Score distribution, and Worst rows — plus per-scorer stat cards.
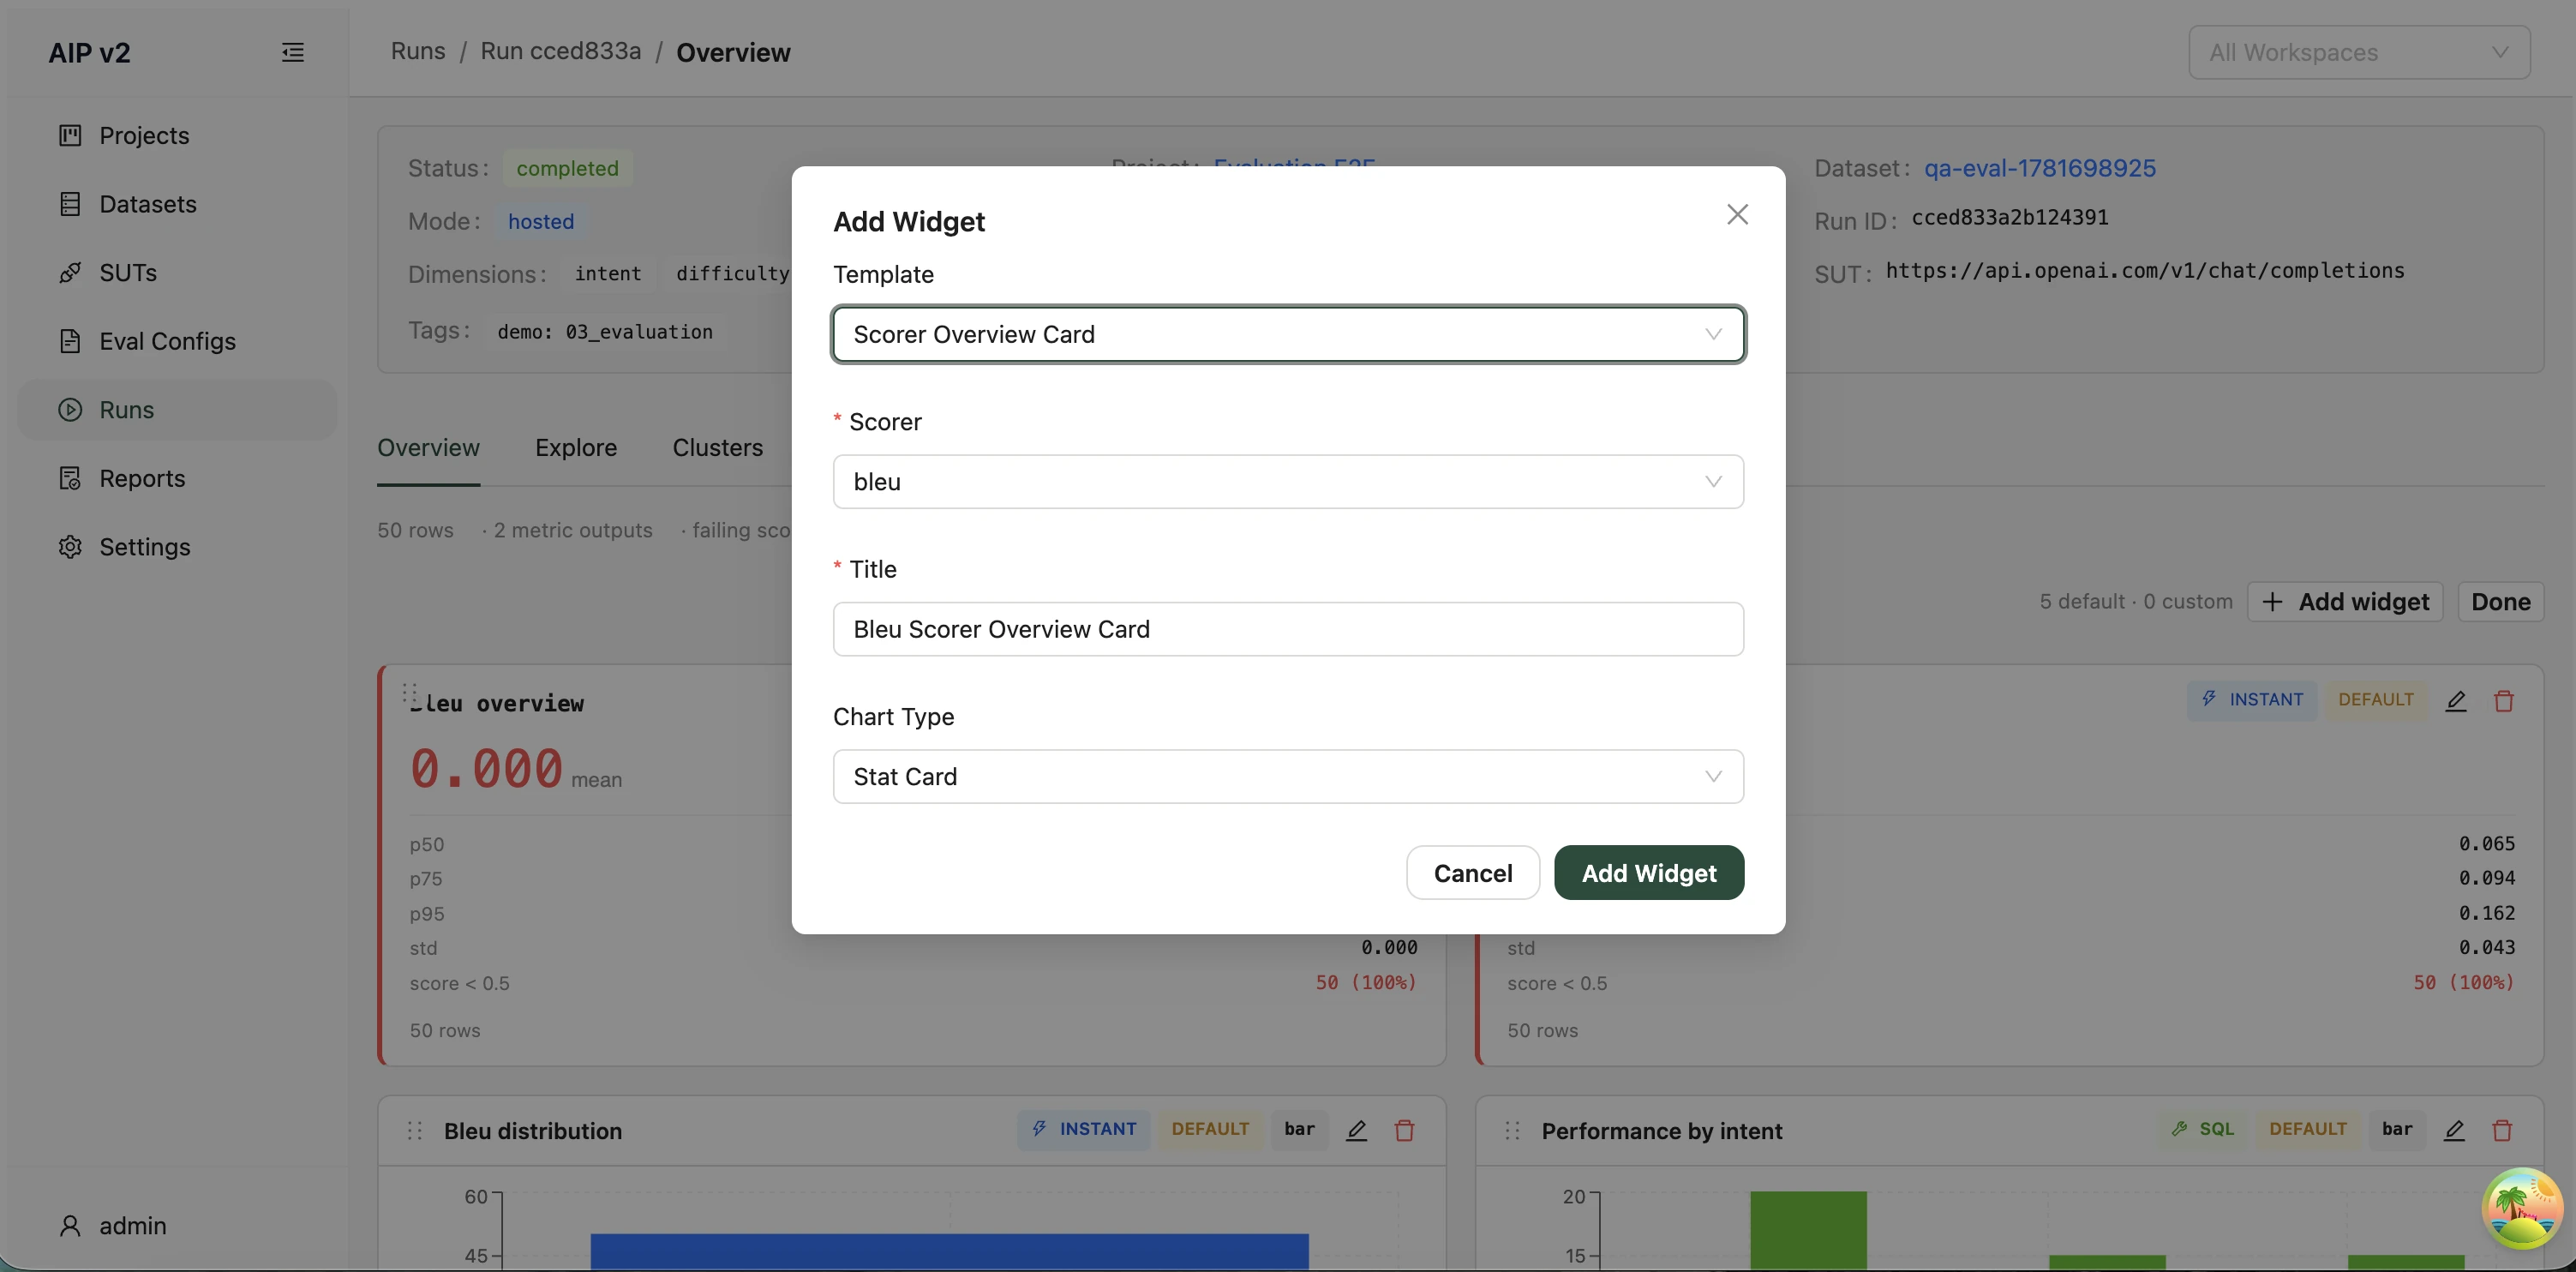
Click Edit to rearrange the dashboard: widgets become drag-and-drop, each with edit/remove controls, and Add Widget opens the builder. Quick widgets are analysis-backed (e.g. Scorer Overview Card, Distribution Histogram); existing SQL widgets can also be edited. Done exits edit mode.
🔎 Explore Tab
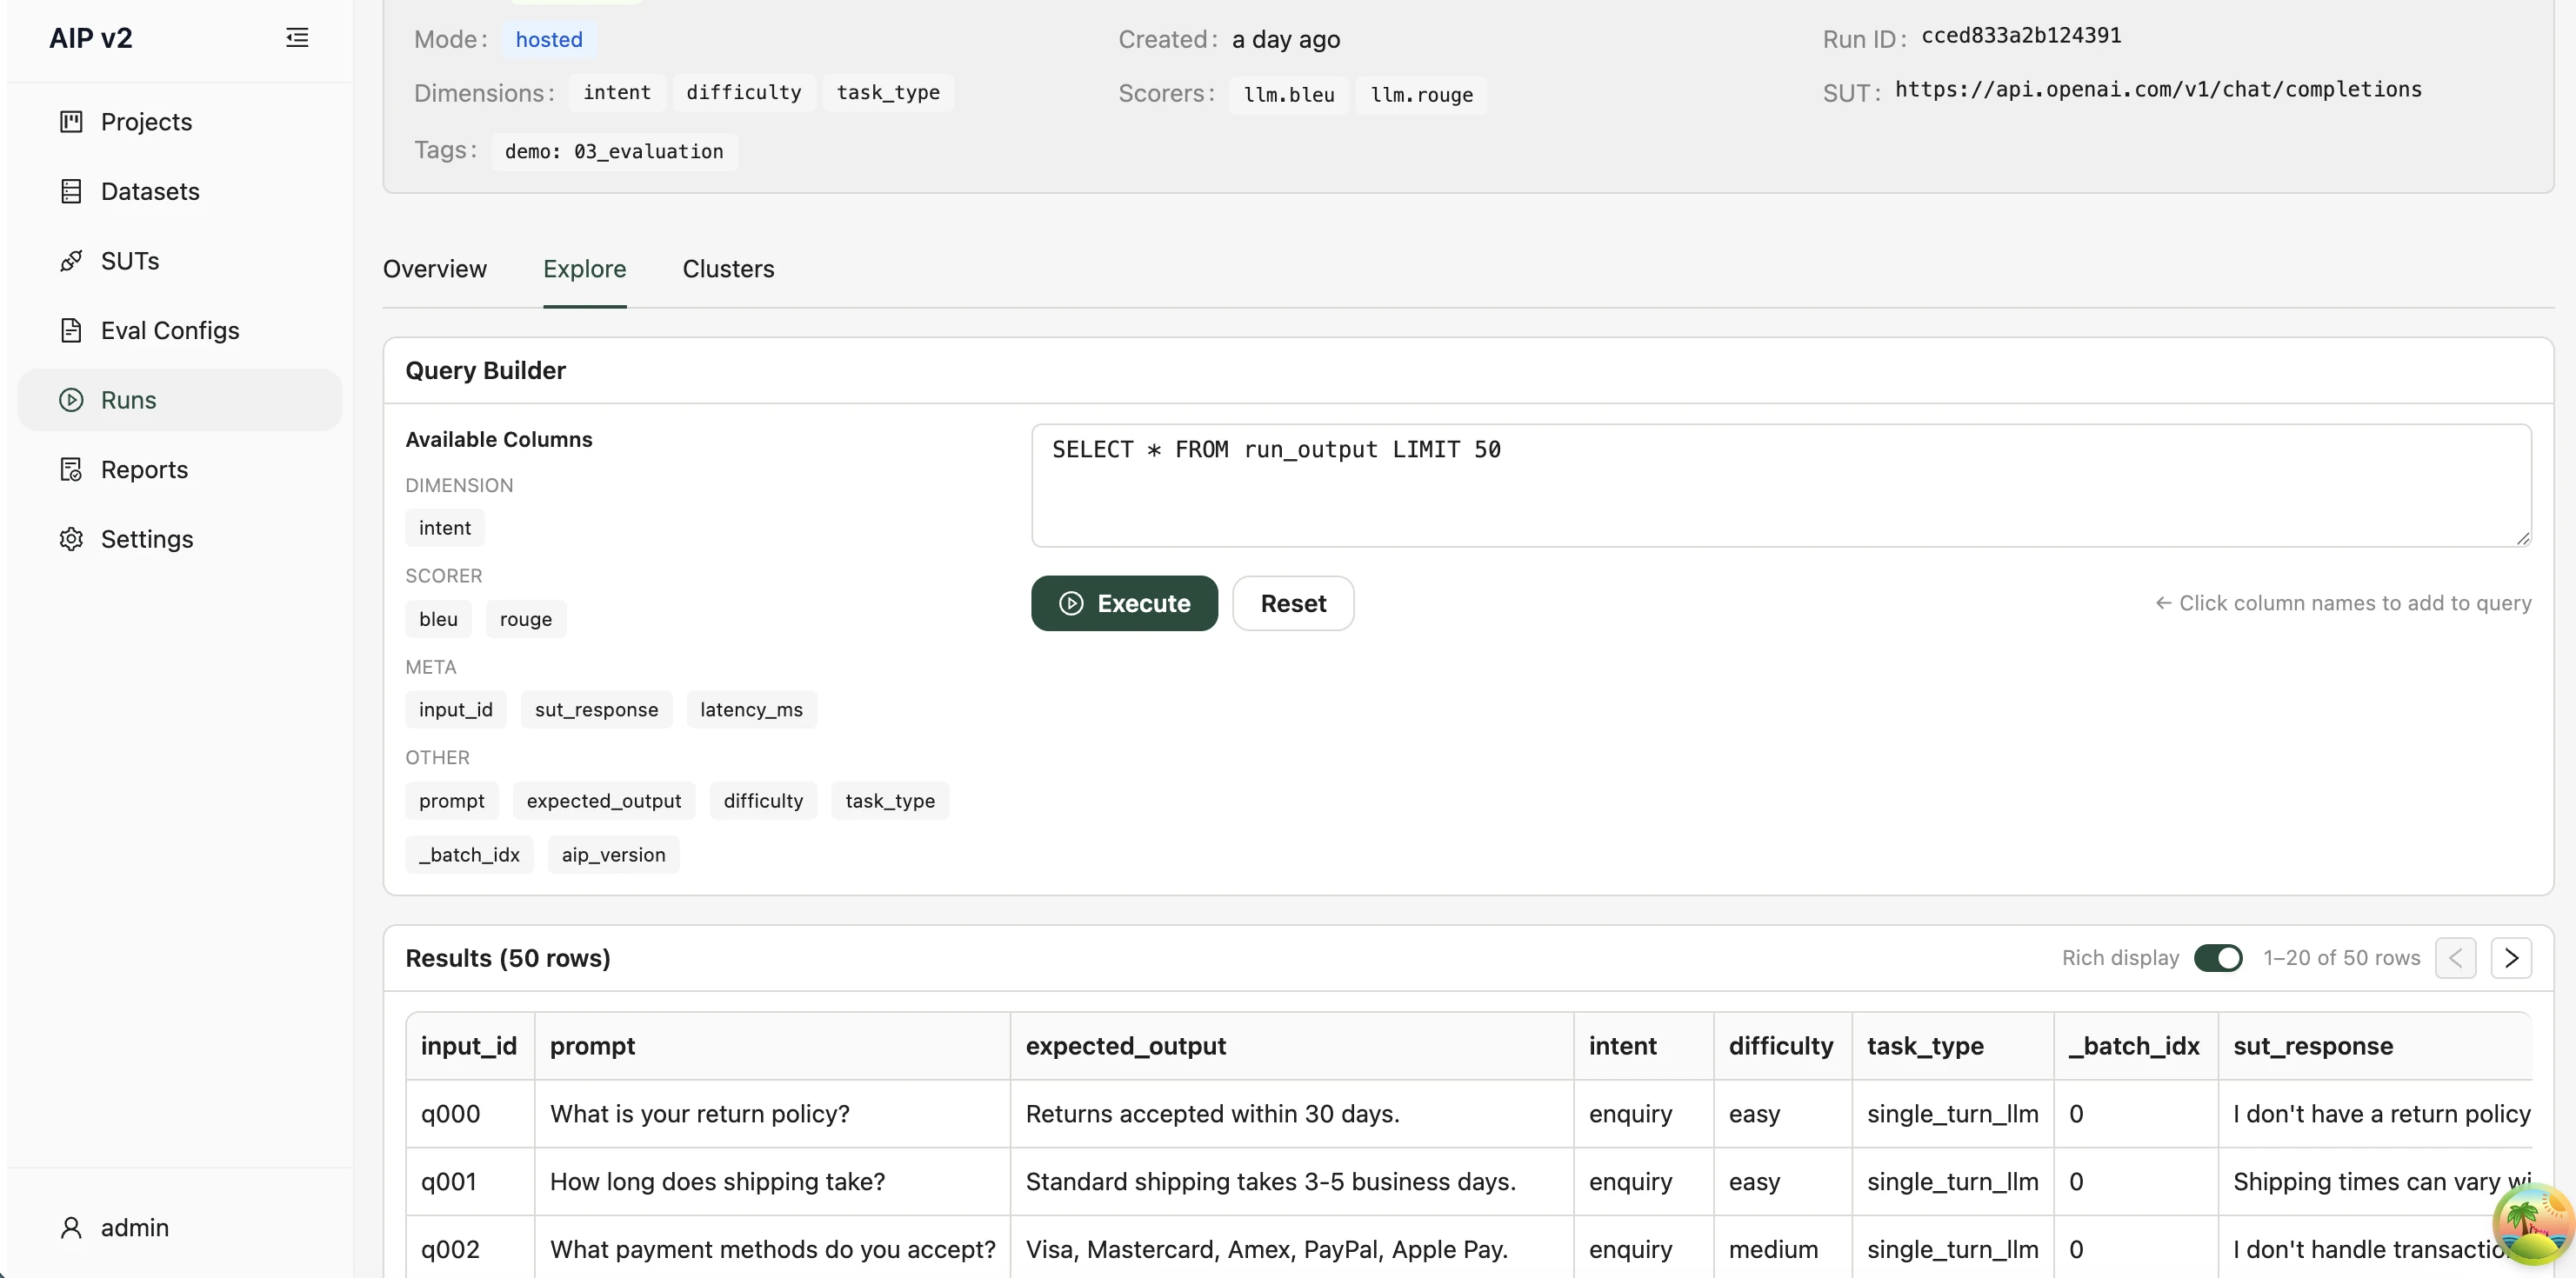
The Explore tab is a SQL workbench over the run's per-row output (also gated on completion). The Query Builder card has a SQL editor (placeholder SELECT * FROM run_output LIMIT 50) on the left and a schema reference on the right — click a column tag to add it to your query. Run the query to populate the Results table (paginated, with the row count in the title); image columns are auto-detected and rendered inline.
SDK equivalent:
run.results()/run.analysis()andaip.get_run(run_id). See Results and reports.
Comparing Two Runs
The Run Compare page puts two views of completed evaluation runs in one place: an aggregate scorer comparison followed by a per-input diff. Run A is the baseline and Run B is the candidate.
Getting There
Open a project and choose its Runs tab. Compare 2 runs stays visible above the evaluation-runs table and is enabled only when exactly two completed evaluation runs are selected. With zero, one, or more than two selected runs, hover the disabled button to see the selection requirement. Failed or in-progress evaluation runs cannot be selected, and non-evaluation pipeline runs stay in the separate table without comparison checkboxes.
Clicking Compare 2 runs opens the project-scoped /runs/compare page with the selected run_a, run_b, and project_id. The project name appears between Runs and Compare in the breadcrumb and returns to that project's Runs tab.
You can also deep-link directly with /runs/compare?run_a=<id>&run_b=<id>&project_id=<id>. The project_id is required; the removed unscoped URL redirects back to Runs. If that project can no longer be resolved, its breadcrumb is omitted and access to the selected runs is still decided by the run endpoints. When the project does resolve, an accessible run from another project is rejected before comparison data loads.
Selecting the Two Runs
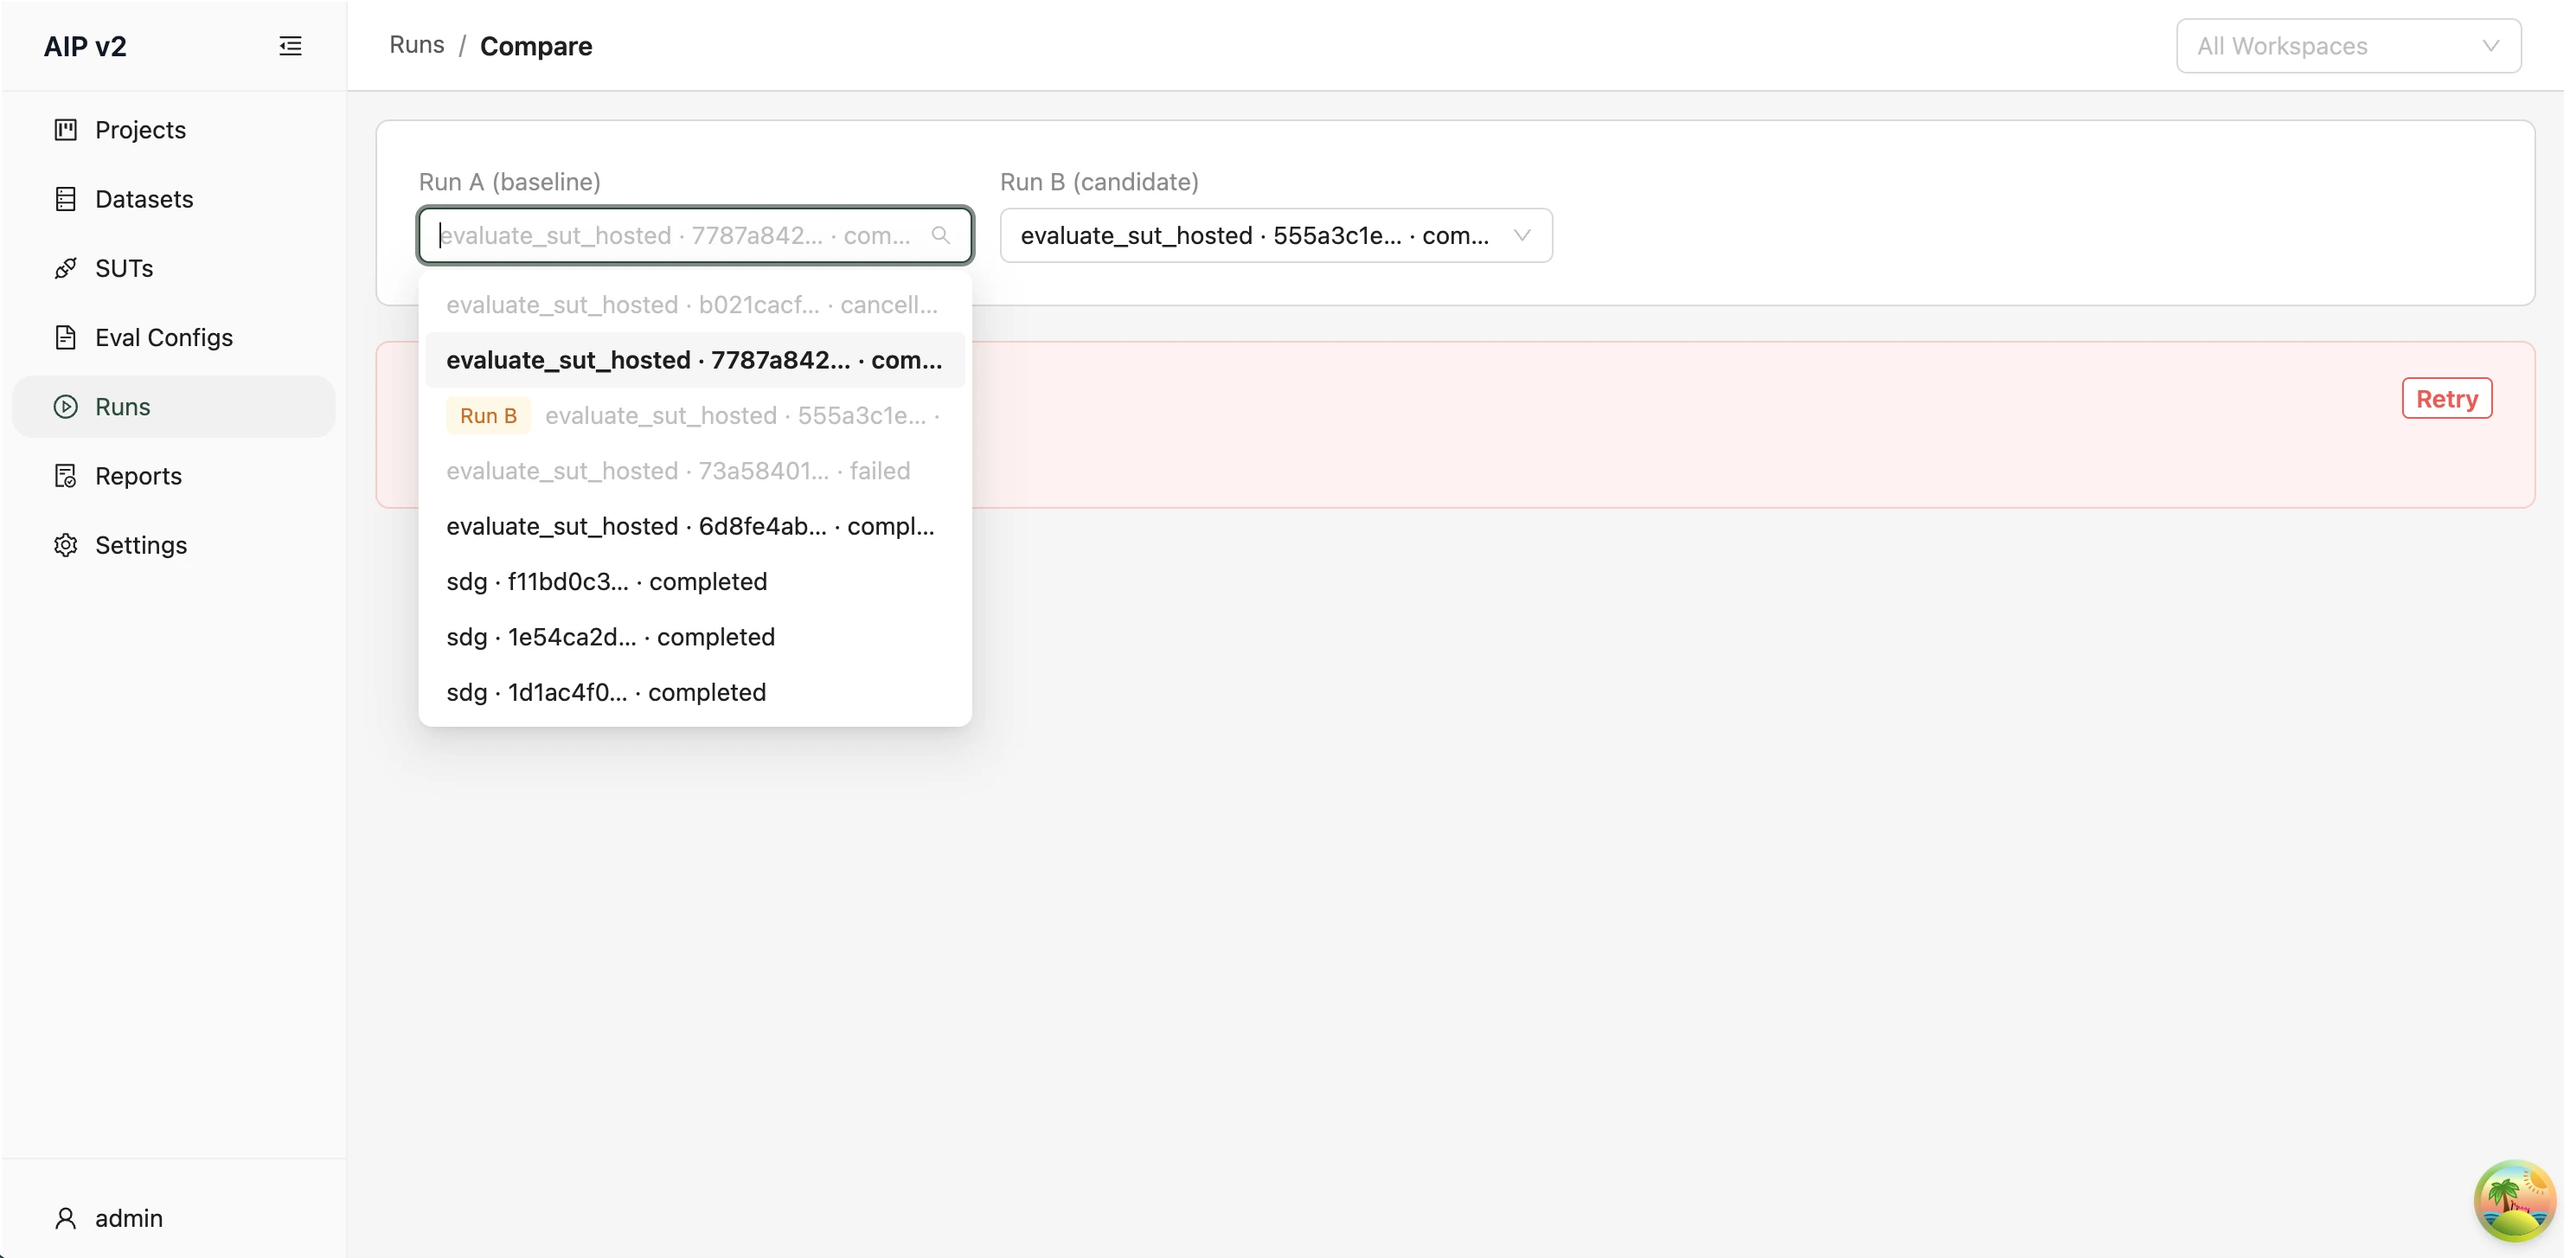
The project selection becomes Run A and Run B on the compare page. Use the two selectors to replace either run when needed. The selectors remain scoped to the source project, and only completed evaluation runs are eligible. The run chosen for Run A is disabled in the Run B list (and vice versa) and appears with an orange Run A / Run B tag so you can see why it is unavailable.
Reading the Scorer Comparison
The Scorer comparison card shows the union of scorer outputs across both runs. Each row contains the scorer, both aggregate mean values, and the effective direction recorded when each run was scored.
- For Higher is better, the larger displayed value is green (winner) and the smaller value is red (loser).
- For Lower is better, the smaller displayed value is green and the larger value is red.
- Inverted stored scores use their effective stored direction, so the verdict still matches the values shown.
- Values equal at four decimal places stay neutral.
- A scorer present on only one run stays neutral and the missing side shows an em dash.
- Missing or conflicting direction metadata stays neutral; the UI does not guess whether higher or lower is better.
- Winner and loser cells include ▲ and ▼ glyphs in addition to colour, so the verdict does not depend on red/green perception.
The scorer summary and per-input diff load independently. If one request fails, the other section can still be used. A deleted or unknown selected run from a stale deep link reaches both requests and shows Run not found in each affected section.
Reading the Diff Table
Below the scorer summary, the Per-input diff card focuses on one explicitly selected primary metric. The selector defaults to the first available scorer and updates every test-case row together, so values from differently scaled metrics are never ranked against each other.
The table renders one row per input_id, joined across the two runs. Top-level columns:
| Column | Meaning |
|---|---|
| Test case | The evaluated row's input_id. |
| Status | How the input appears across the two runs (see below). |
| Run A / Run B | The selected primary metric's value for each run. |
| Change (A − B) | The selected metric's signed arithmetic change. |
Status tags:
| Tag | Colour | Meaning |
|---|---|---|
| matched | grey | The input exists in both runs. |
| new | blue | Present only in Run B (the candidate). |
| missing | orange | Present only in Run A (the baseline). |
Expand a row (the + control) to see every remaining metric as Scorer / Run A / Run B / Change (A − B). Changes use neutral styling because a positive or negative value alone does not say whether the candidate improved; that depends on the scorer's direction. An — (em-dash) means there is no comparable score for that run or metric.
Sorting and Filtering
The Primary metric selector is available immediately and changes the metric shown in the top-level comparison. The Status filter and sortable column headers remain disabled until server-side filtering and sorting are available; hovering the status control shows "Server-side sort/filter coming in a future release." Rows are returned pre-joined and paginated; the footer shows "Showing N of M row(s)" and a Load more button appears when more rows are available.
Exporting a Comparison as CSV
The Export CSV button sits in the top-right toolbar of the Per-input diff card. It downloads the full diff for the selected run_a / run_b (every row, both runs) as a CSV file.
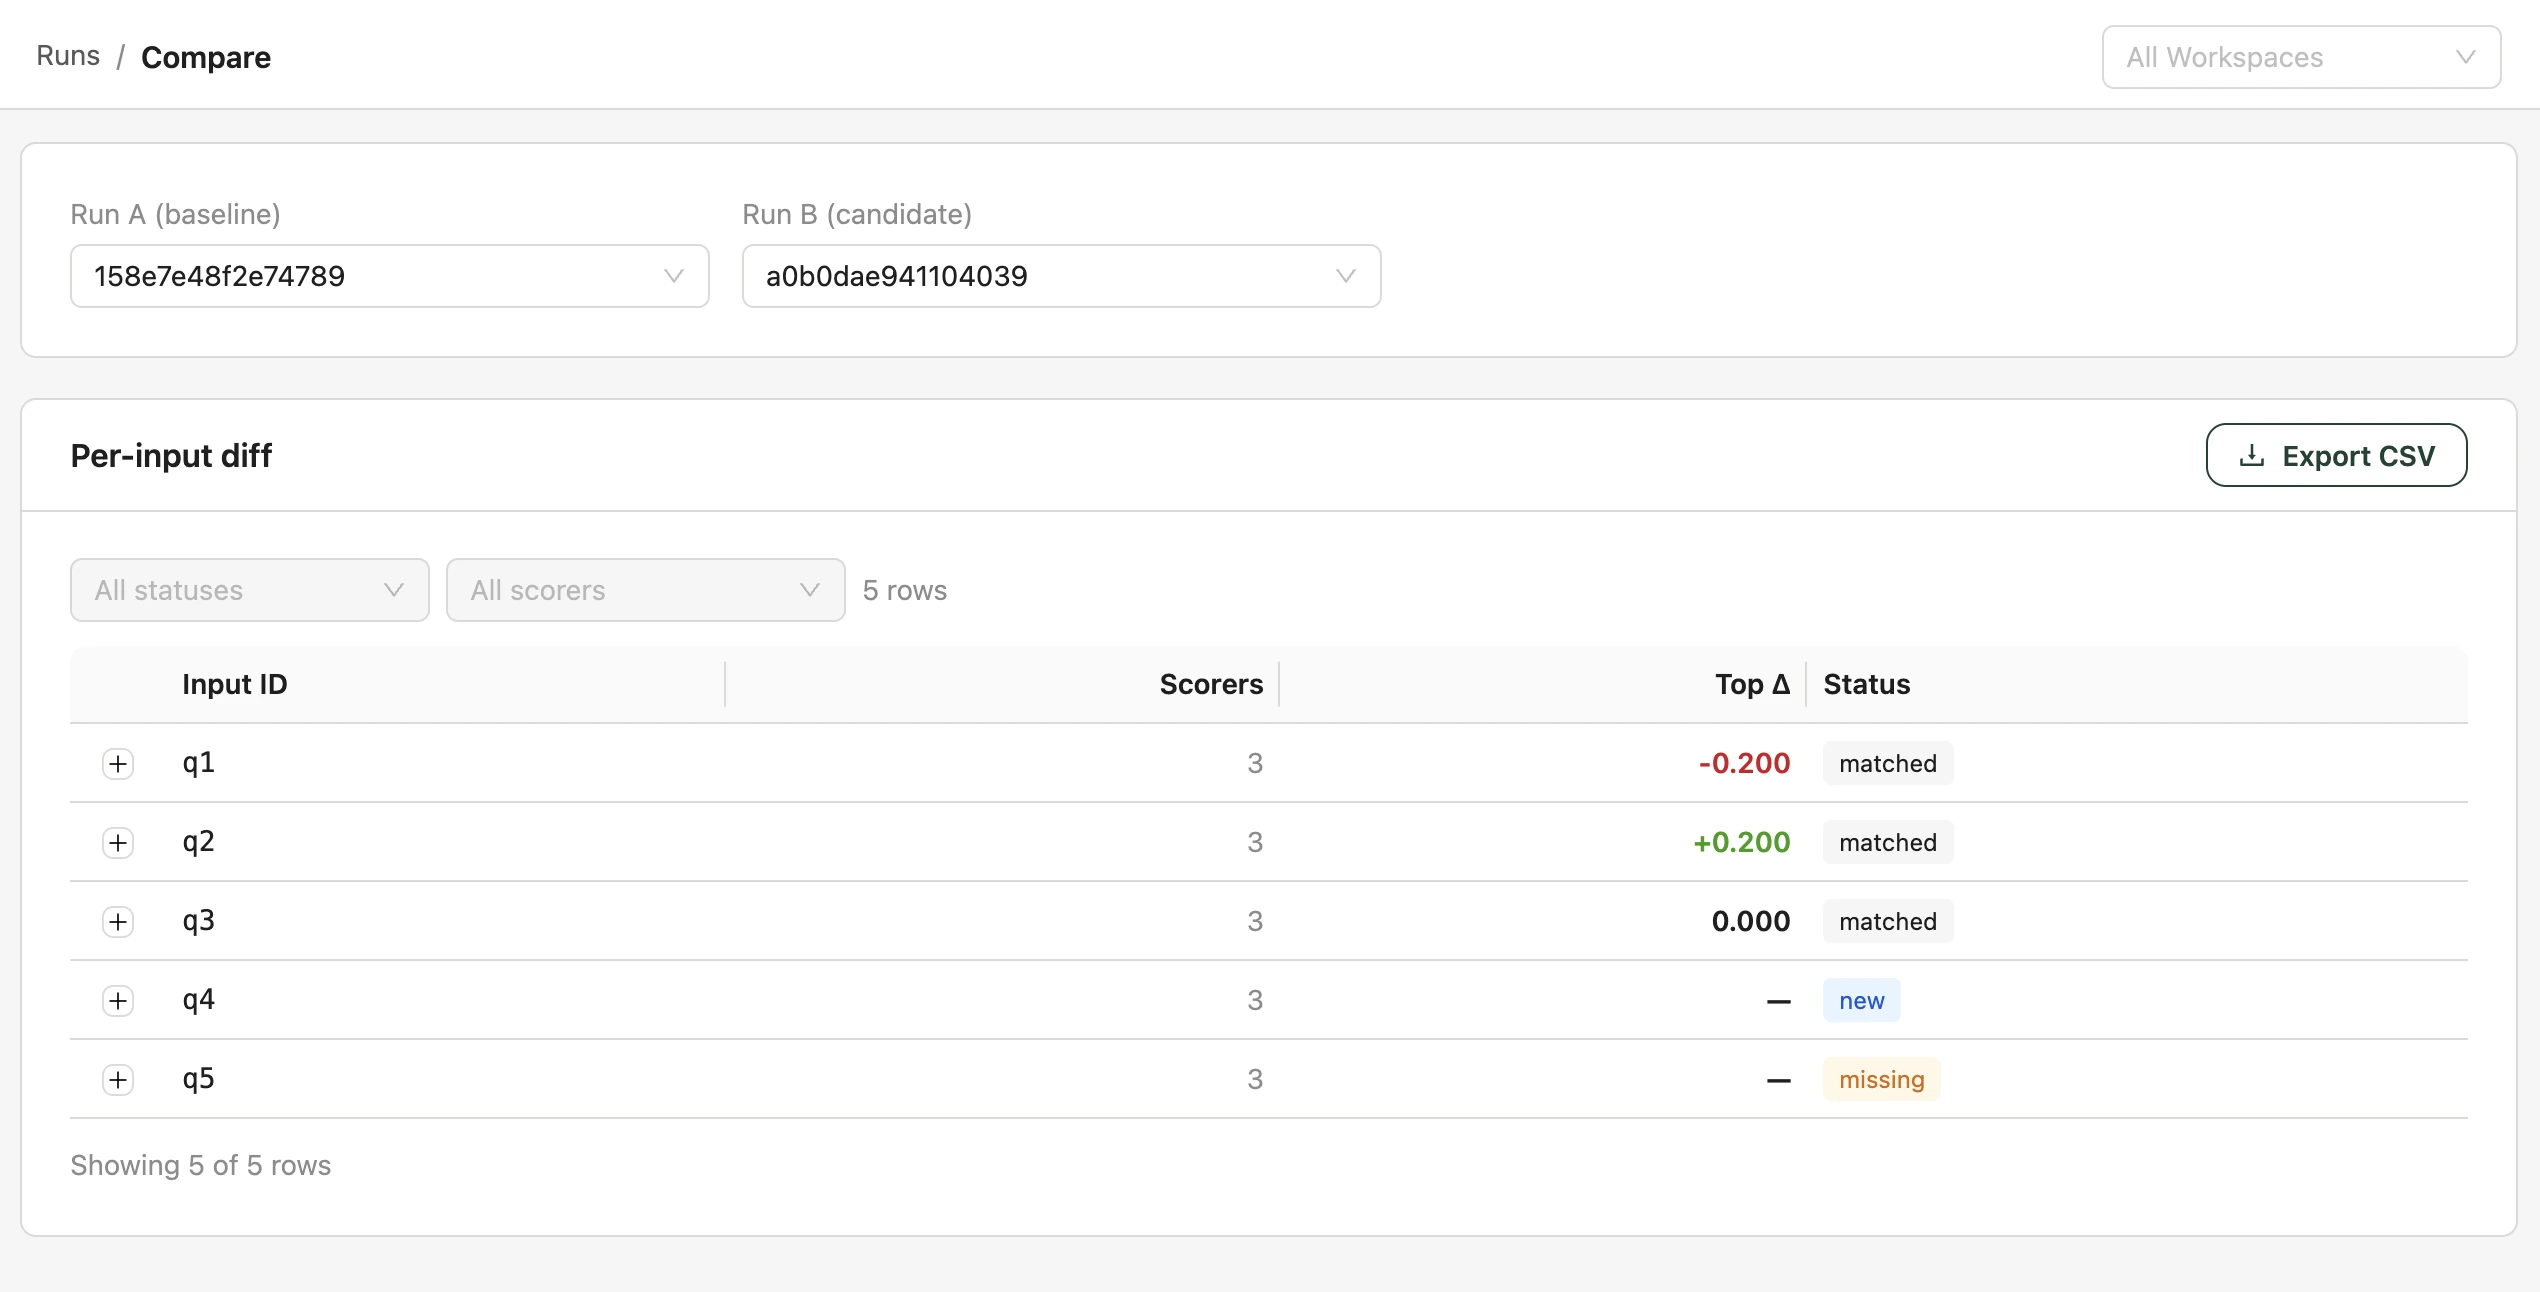
- Default label: Export CSV
- While exporting: the button shows Exporting… with a spinner.
- Large comparisons (>10k rows): the download is streamed from the server, so the browser stays responsive — there's no need to wait for the whole table to render before exporting.
- When there are no rows to export: the button is disabled with the tooltip "Load a comparison with at least one row to export."
- If the export fails: the button switches to Retry export; click it to try again.
The CSV columns are input_id, row_status, and per-scorer _a / _b / _delta triples — the same data shown in the table.
SDK equivalent: the same export is available programmatically via aip.diff(run_a, run_b).export(path="diff.csv") — see Comparing runs.
Inspecting Failure Clusters
The Clusters tab on a run's detail page groups failing rows into clusters so you can see where a model is failing. Open it at /runs/\<run_id\>/clusters (or click the Clusters tab on any completed run's detail page).
Clusters are only available for completed runs. If the run hasn't finished, the tab shows "Failure clusters are available once the run has completed." If the run completed with no failures, it shows "No cluster data available."
Reading the Heatmap
The Failure clusters card renders a heatmap:
- Rows = failure modes (e.g. "confusion_matrix below 0.5").
- Columns = scorers.
- Each cell shows
failures / totalfor that failure-mode × scorer, shaded on a red intensity scale — the higher the failure rate, the deeper the red.
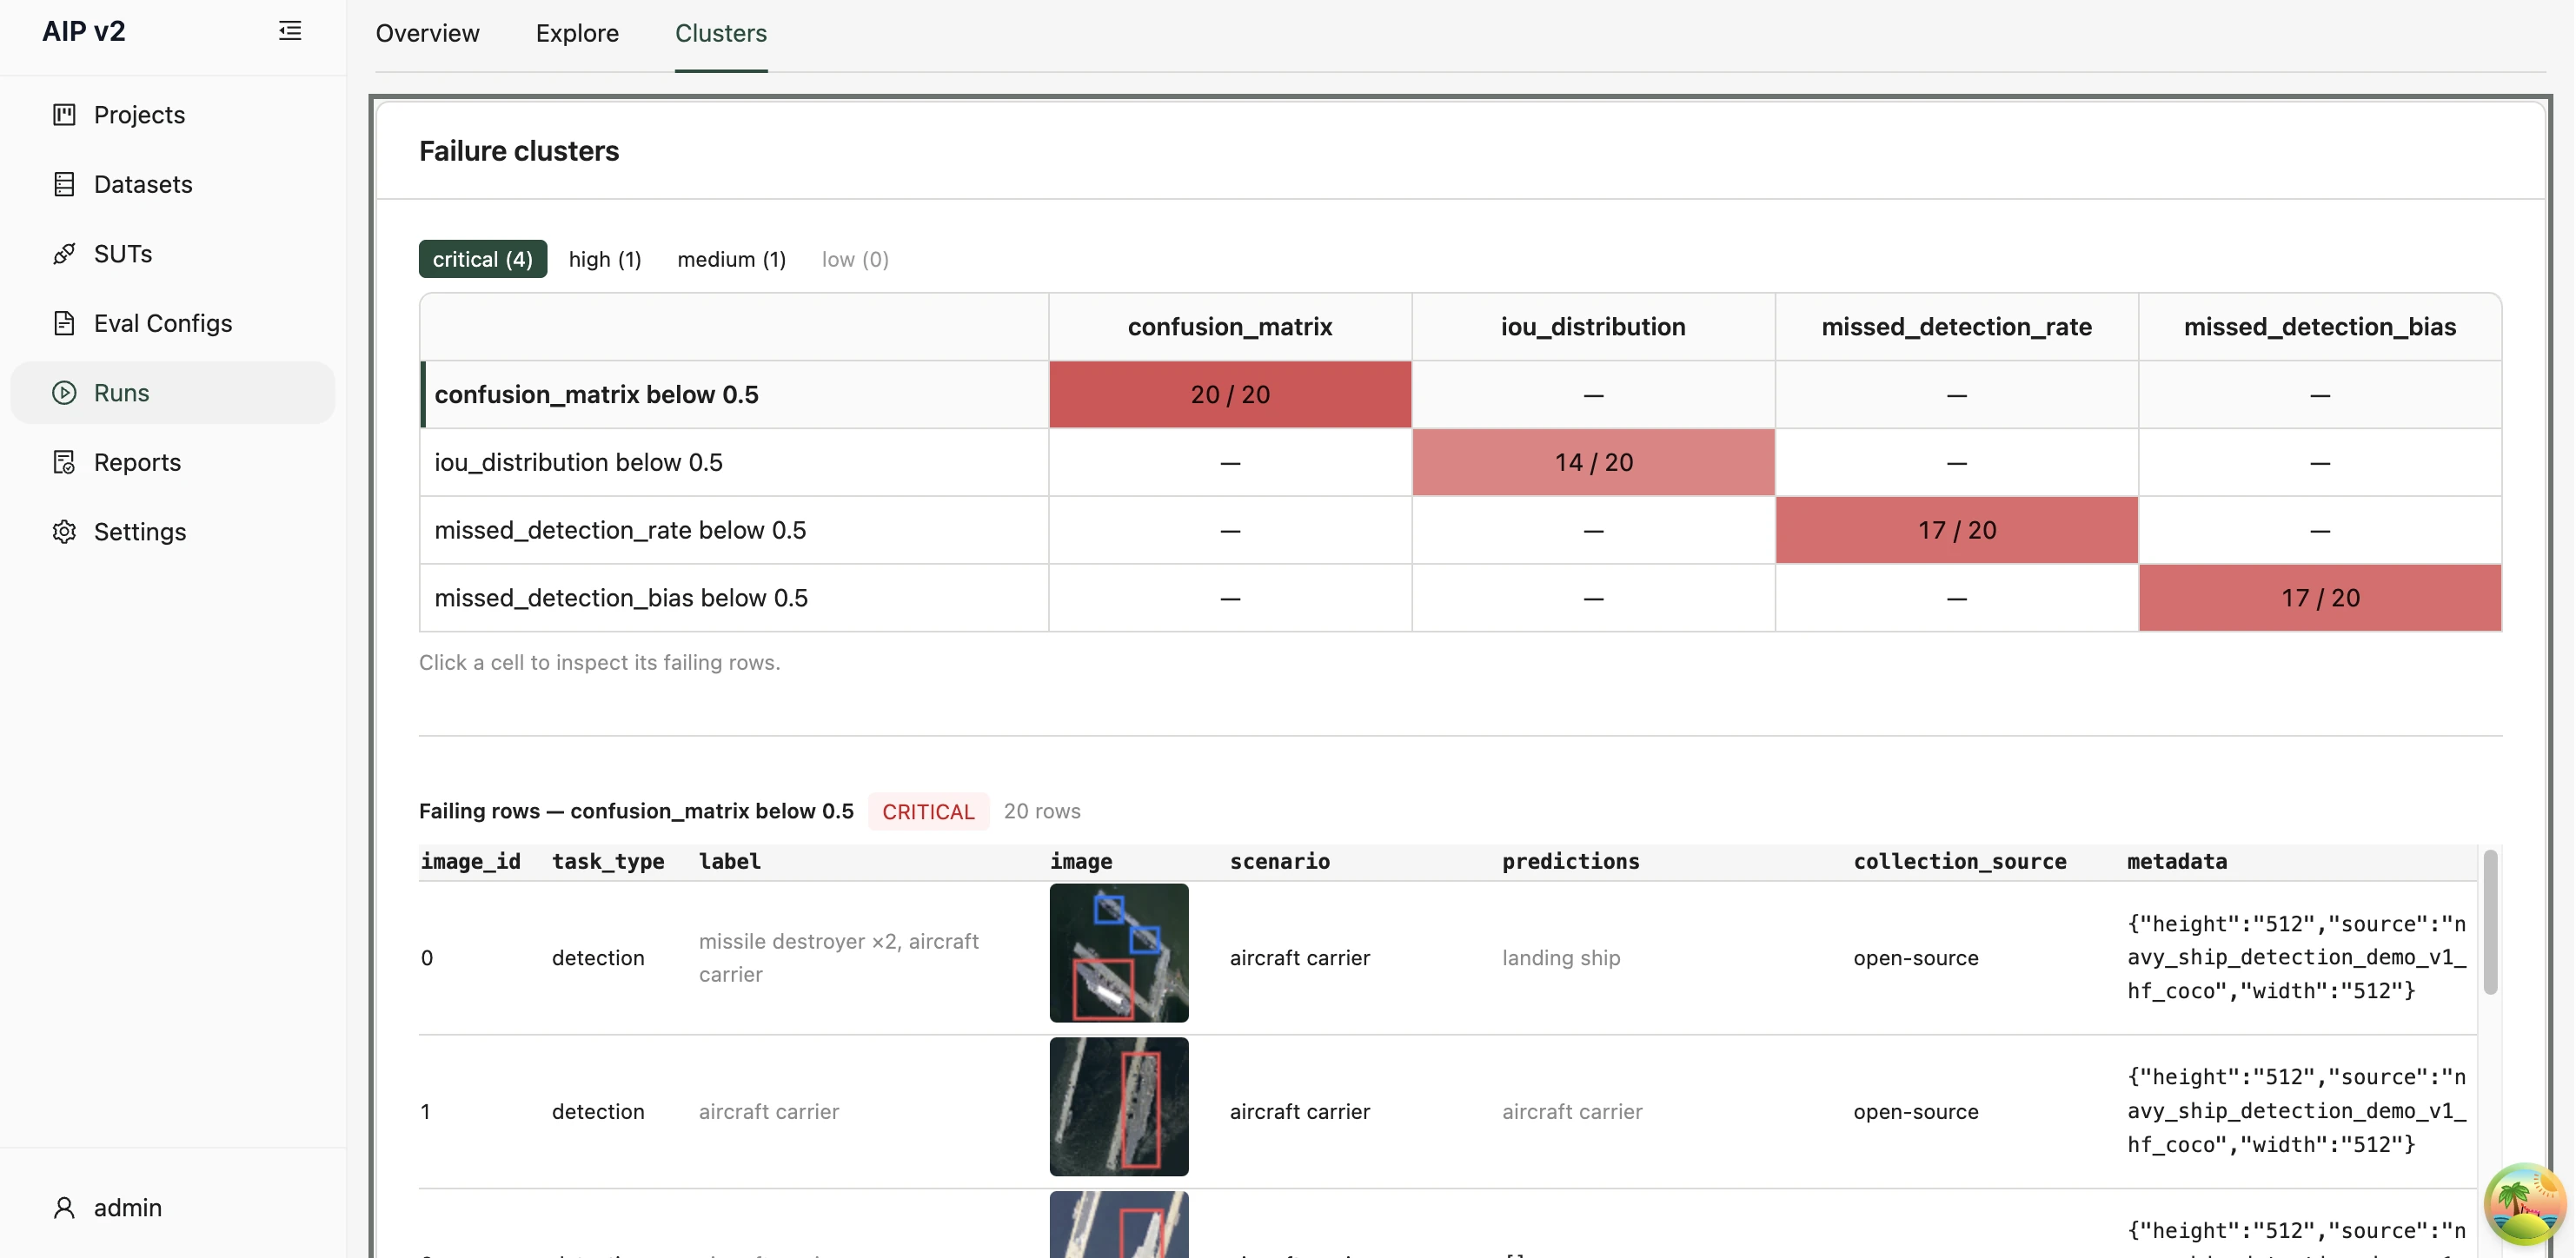
Above the heatmap, severity filter chips summarise the clusters by severity — critical, high, medium, low — each with a count, e.g. critical (4). A helper line reads "Click a cell to inspect its failing rows."
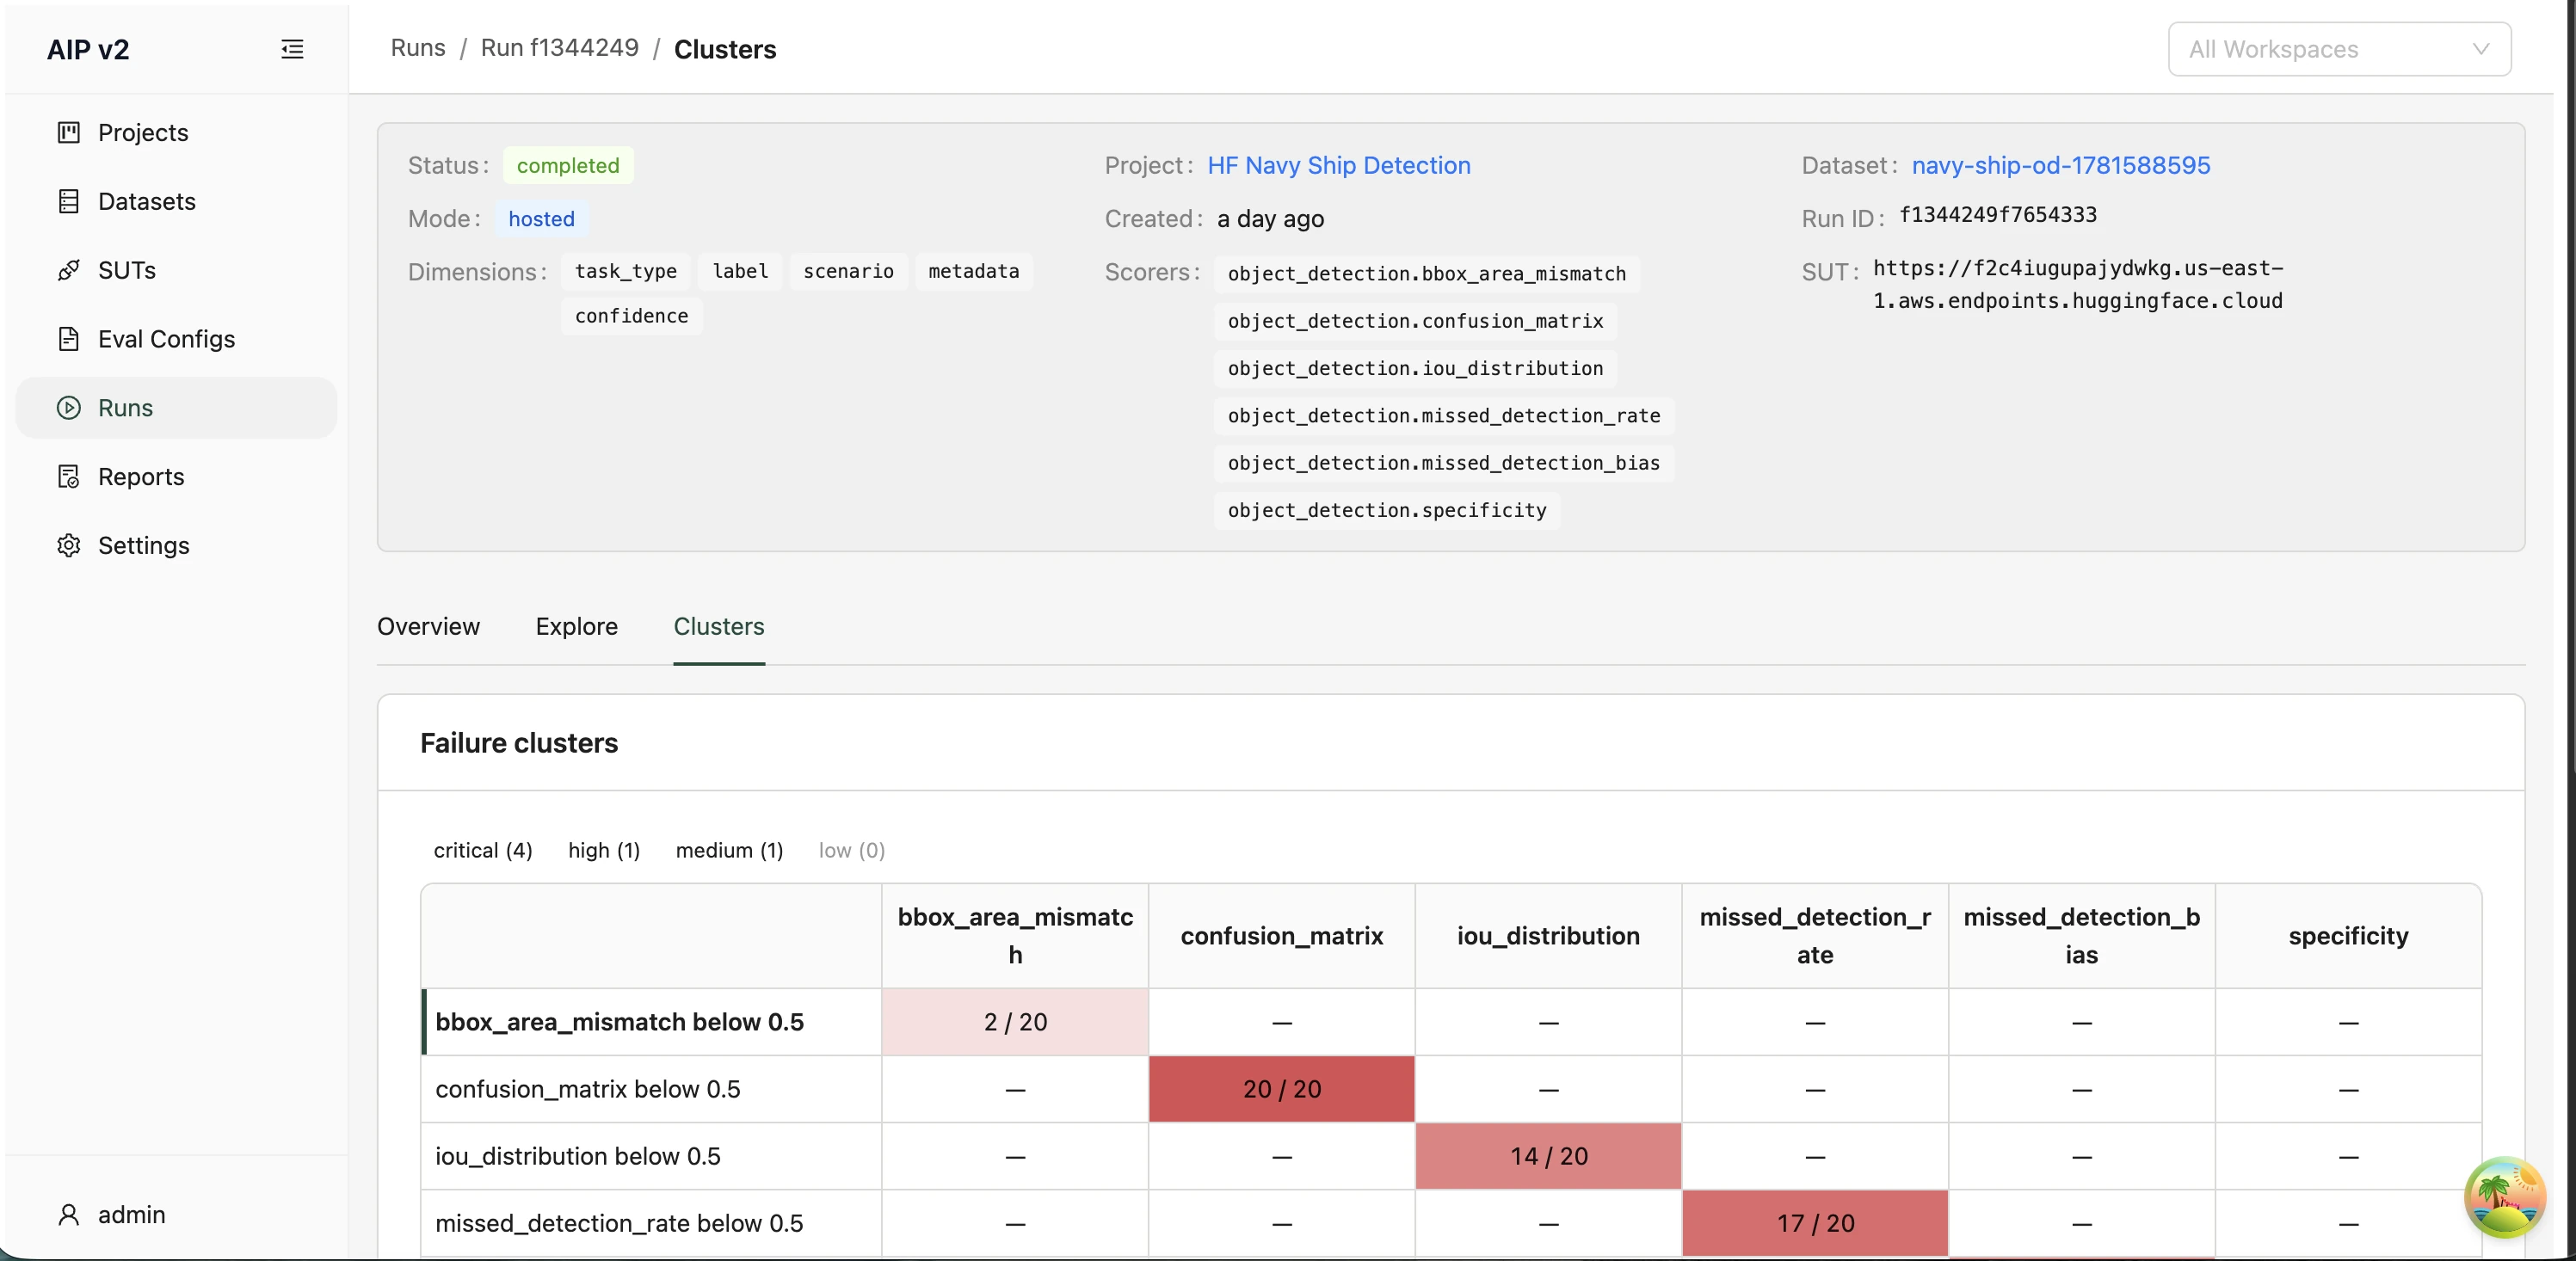
Hovering a cell shows a tooltip with the failure mode, the cluster size, and the per-scorer fail rate, e.g.:
Failure mode: confusion_matrix below 0.5
Cluster size: 20 rows
Scorer: confusion_matrix · 100% fail rate
Click a severity chip (e.g. critical) to filter both the heatmap and the failing-rows list to that severity; the choice is stored in the URL as ?severity=critical. Click again to clear it. Chips with a zero count are disabled. If a filter leaves nothing, the card shows "No clusters match the selected severity."
Drilling into Failing Rows
Click a cell (or focus it and press Enter) to drill down. The selected cluster's failing rows appear in a list below the heatmap, titled "Failing rows — ", tagged with the cluster's severity and a row count. The list is virtualised, so it stays smooth even with thousands of rows. The selection is reflected in the URL (?clusterId=…), so a drilled-down view is shareable. An empty cluster shows "No failures detected" rather than an error.
The heatmap is fully keyboard-navigable: arrow keys move between cells and Enter drills into the focused cell.
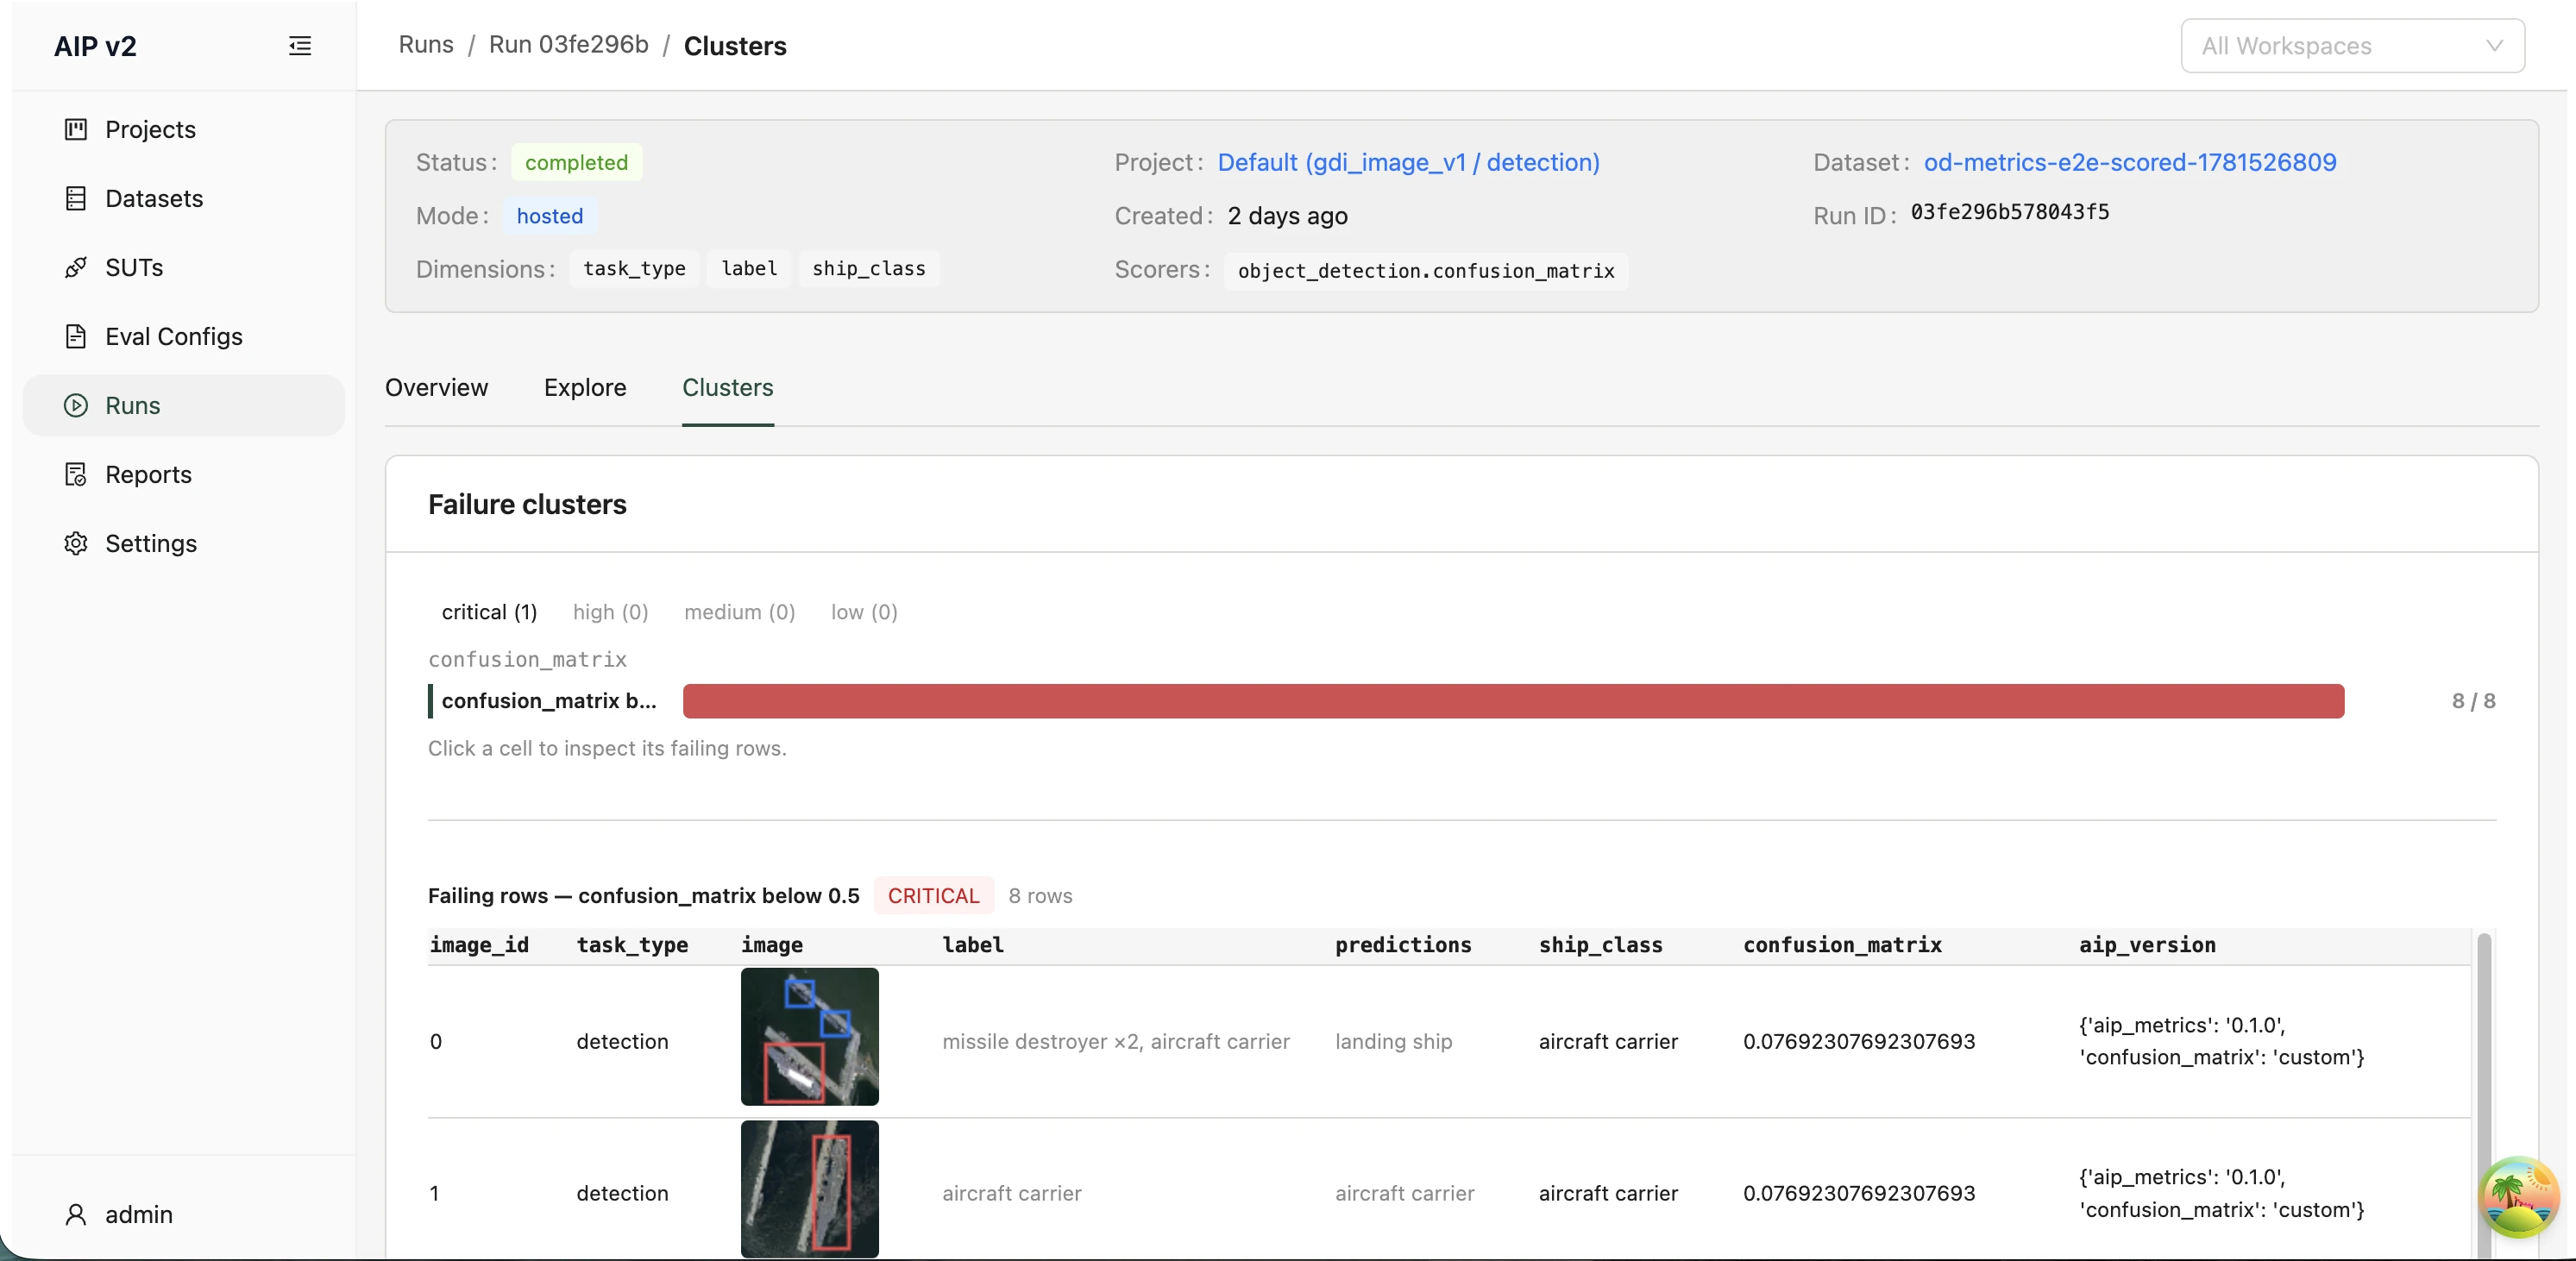
Single-Scorer Runs (1D Fallback)
When a run has only one scorer, a 2D grid isn't meaningful, so the heatmap falls back to a horizontal bar chart — one bar per cluster, bar length and colour encoding the failure rate. Clicking a bar (or Enter/Space) drills in the same way as a heatmap cell.
📝 Report Builder
The Report Builder turns a completed evaluation run into a shareable, governance-grade report — cover page, scope, methodology, executive summary, detailed findings, and recommendations. The platform drafts it for you; you then customise what goes in, edit the prose right in the browser, and export a branded PDF. Open it from Reports in the left sidebar.
A report is generated asynchronously: you compose it in a short wizard, the platform queues a generation job, and the report appears in the list — first as Generating, then Completed or Failed. A completed report opens in an on-platform editor (not a static PDF), where your edits are saved back to the report and reflected in the export.
➡️ The Reports List
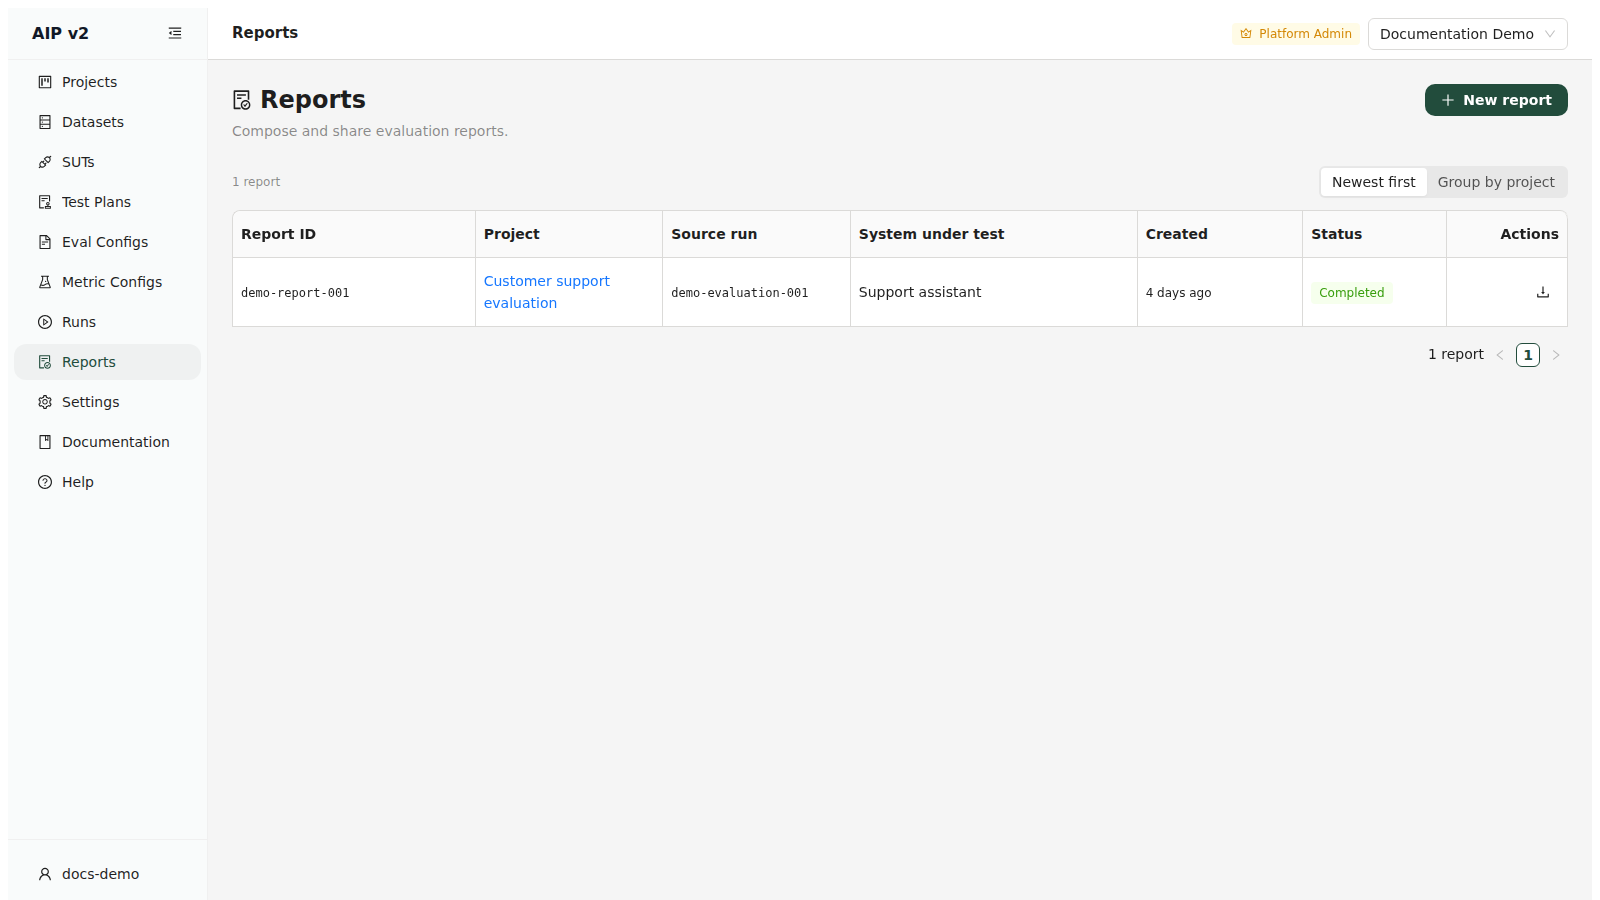
The Reports page lists every report, newest first — one per table row. Toggle Newest first / Group by project at the top right.
| Column | Meaning |
|---|---|
| Report ID | The report's identifier — a link once the report is ready to open (a plain label while it's still generating). |
| Source run | The completed run the report was built from — links through to that run. |
| System under test | The SUT captured at creation time (hover for the full name). |
| Created | Relative timestamp (hover for the exact time). |
| Status | The generation lifecycle (see below). |
| Actions | Open the report to view, edit, and export it. |
The Status tag tracks the generation job:
| Status | Colour | Meaning |
|---|---|---|
| Pending / Generating | blue (animated) | Still in flight — the list auto-refreshes until it finishes. |
| Completed | green | Ready to open in the editor and export. |
| Failed | red | Generation ended with no artefact — open it to see why. |
If there are no reports yet, an empty state invites you to generate one from a completed evaluation run. New report (top-right) opens the builder.
✳️ Creating a Report — the 3-Step Wizard
The New report button opens a three-step wizard — Report Setup → Report Content → Review & Edit — with the current step shown in the progress bar at the top.
Step 1 — Report Setup. Choose the source run, then choose which sections to include.
- Source run — a searchable picker of your completed runs (only completed evaluation runs can be reported on). Picking a run loads its question schema, which drives the rest of the form.
- Sections to include — the report is made of 9 sections (listed below). All are selected by default; clear the ones you don't need, and Select all / Clear all toggles the lot. The sections you keep determine which questions the next step asks — and are stamped into the report's provenance footer (see Export & Provenance).
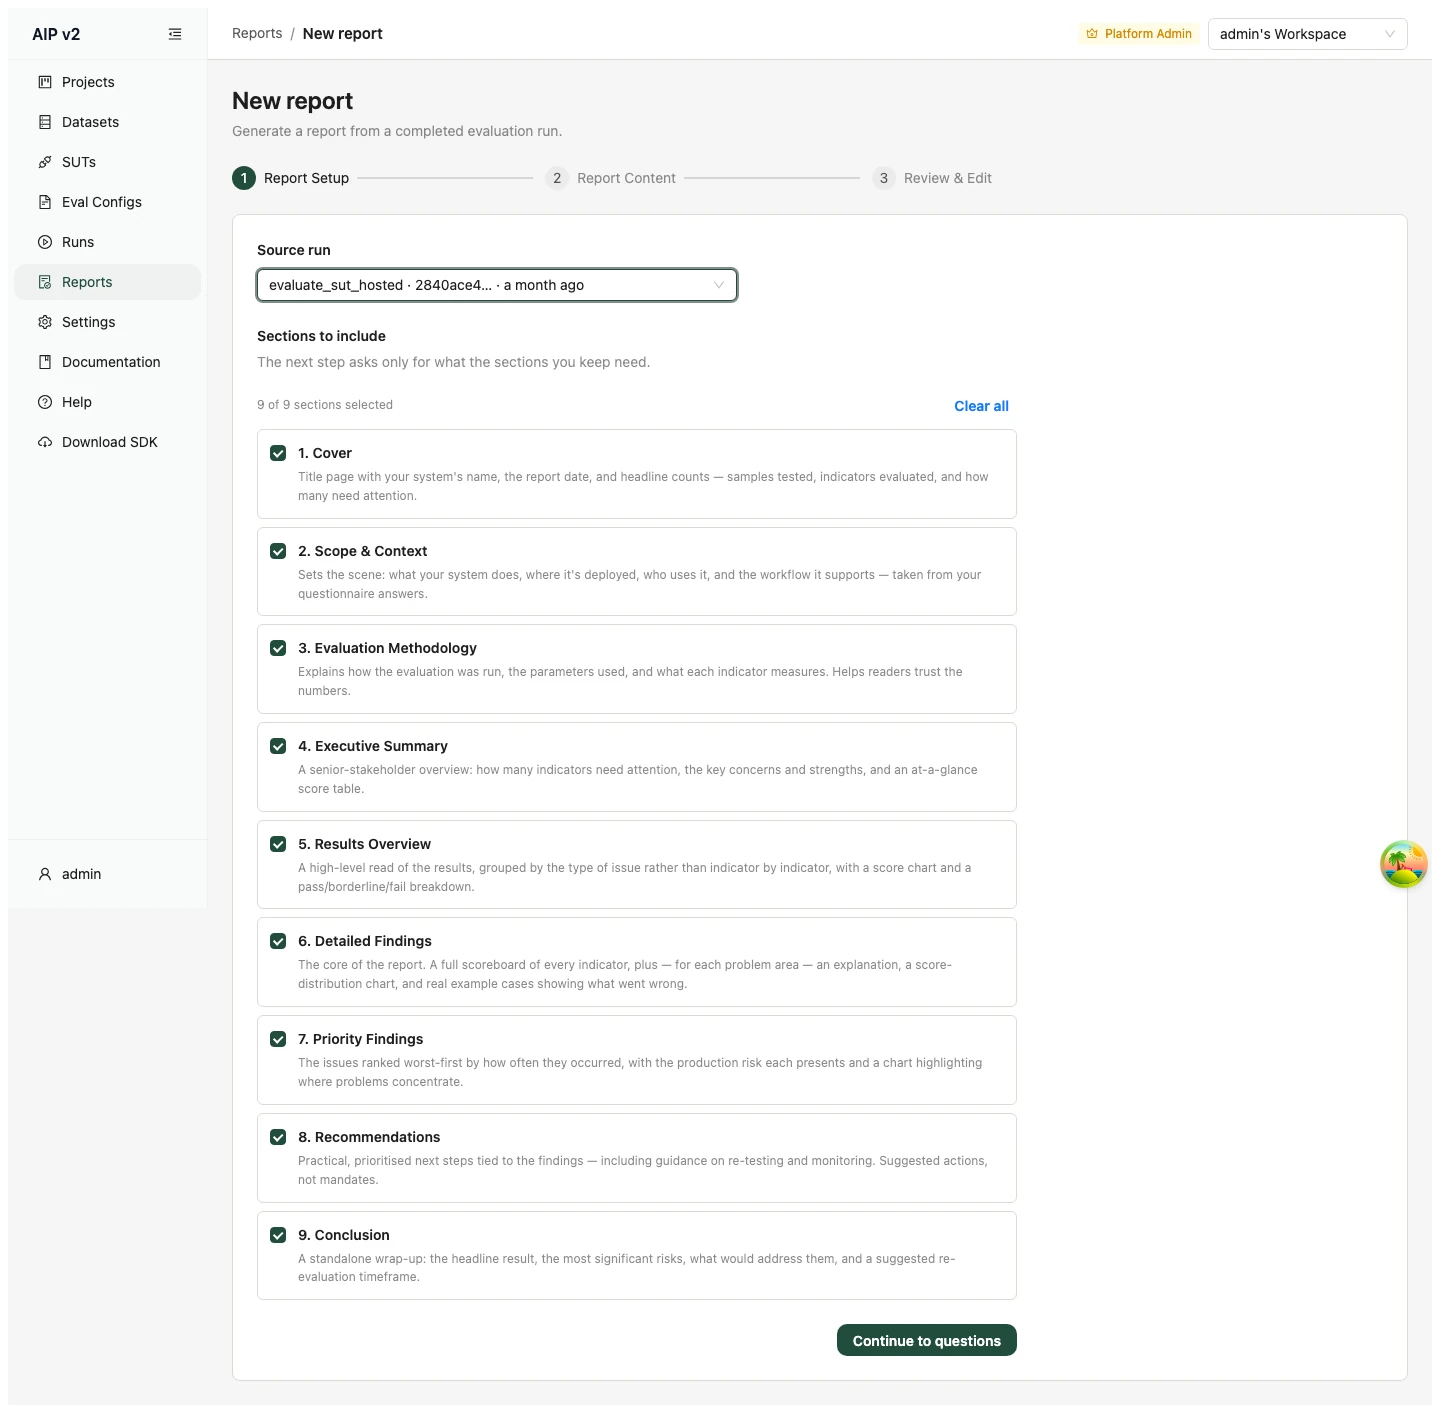
The nine sections, in report order:
- Cover — Title page with your system's name, the report date, and headline counts — samples tested, indicators evaluated, and how many need attention.
- Scope & Context — Sets the scene: what your system does, where it's deployed, who uses it, and the workflow it supports — taken from your questionnaire answers.
- Evaluation Methodology — Explains how the evaluation was run, the parameters used, and what each indicator measures. Helps readers trust the numbers.
- Executive Summary — A senior-stakeholder overview: how many indicators need attention, the key concerns and strengths, and an at-a-glance score table.
- Results Overview — A high-level read of the results, grouped by the type of issue rather than indicator by indicator, with a score chart and a pass/borderline/fail breakdown.
- Detailed Findings — The core of the report: a full scoreboard of every indicator, plus — for each problem area — an explanation, a score-distribution chart, and real example cases showing what went wrong.
- Priority Findings — The issues ranked worst-first by how often they occurred, with the production risk each presents and a chart highlighting where problems concentrate.
- Recommendations — Practical, prioritised next steps tied to the findings — including guidance on re-testing and monitoring. Suggested actions, not mandates.
- Conclusion — A standalone wrap-up: the headline result, the most significant risks, what would address them, and a suggested re-evaluation timeframe.
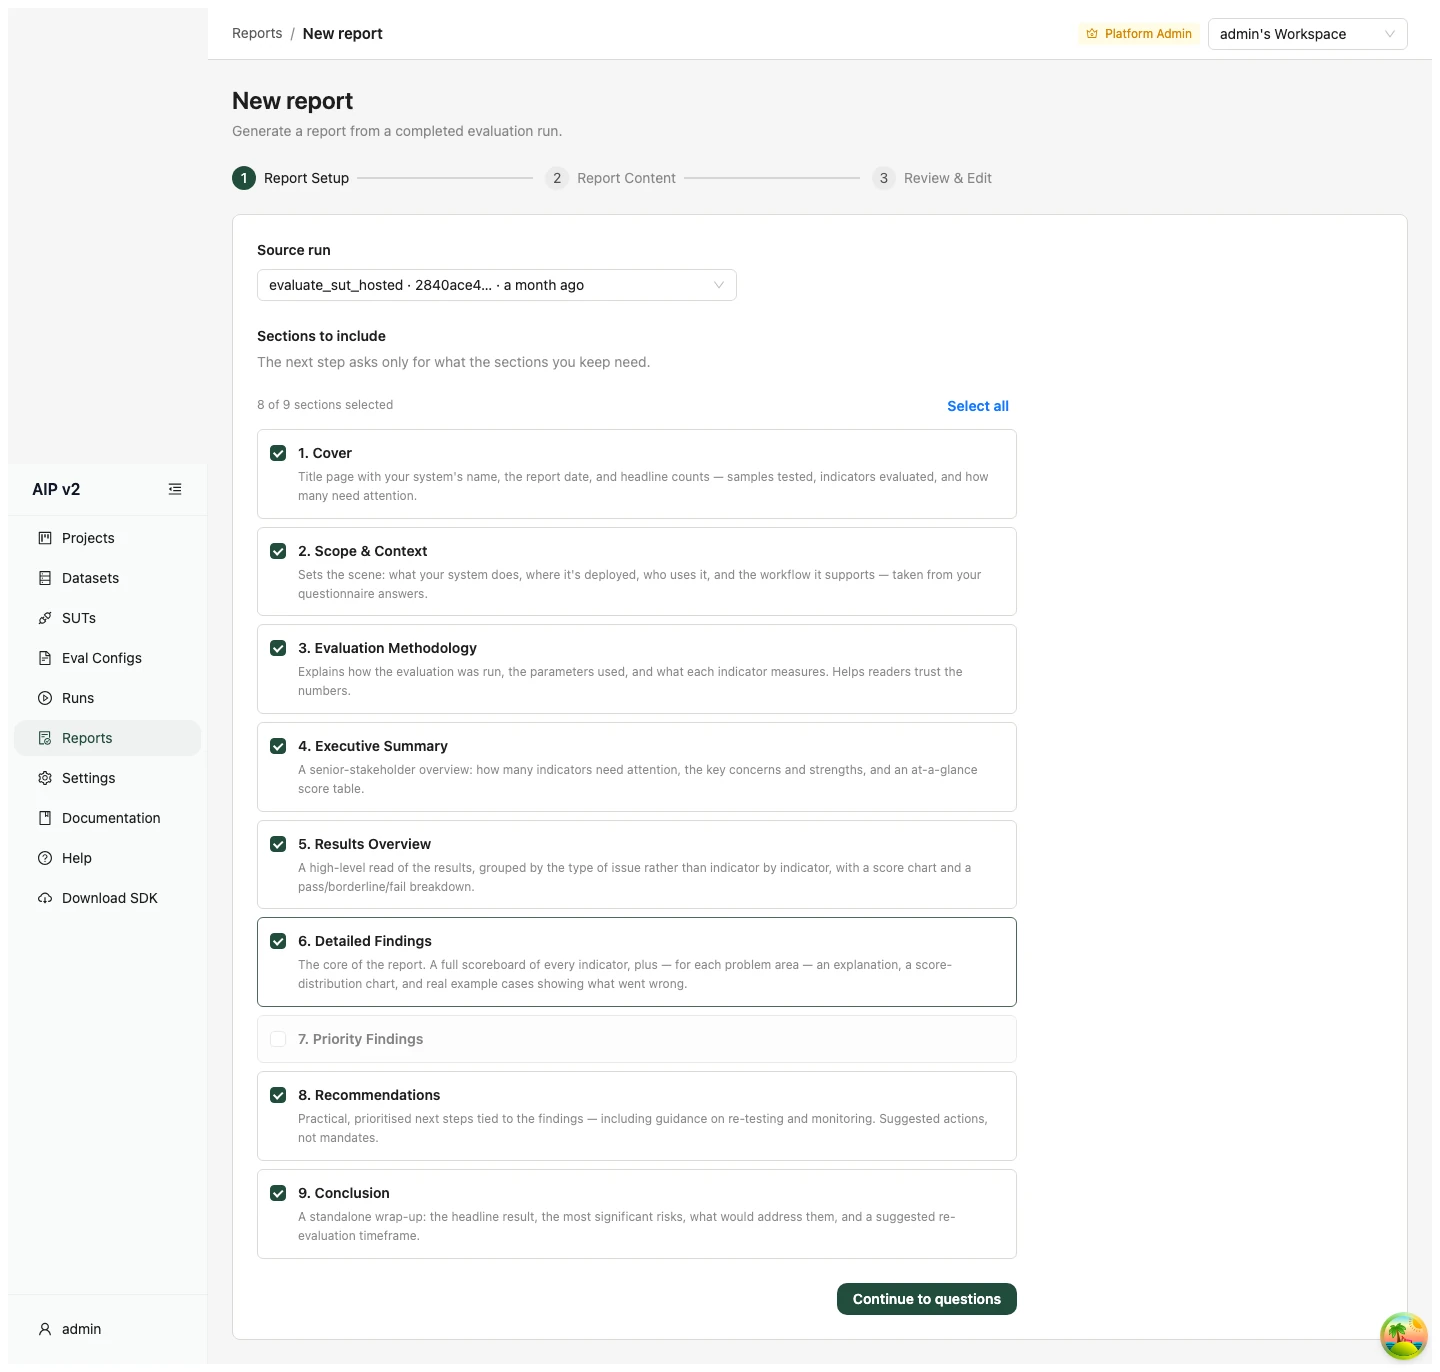
Deselecting a section folds it down to a dimmed header, so you can see at a glance what's in and what's out. Here Priority Findings has been cleared — a custom, 8-of-9 selection:
Click Continue to questions.
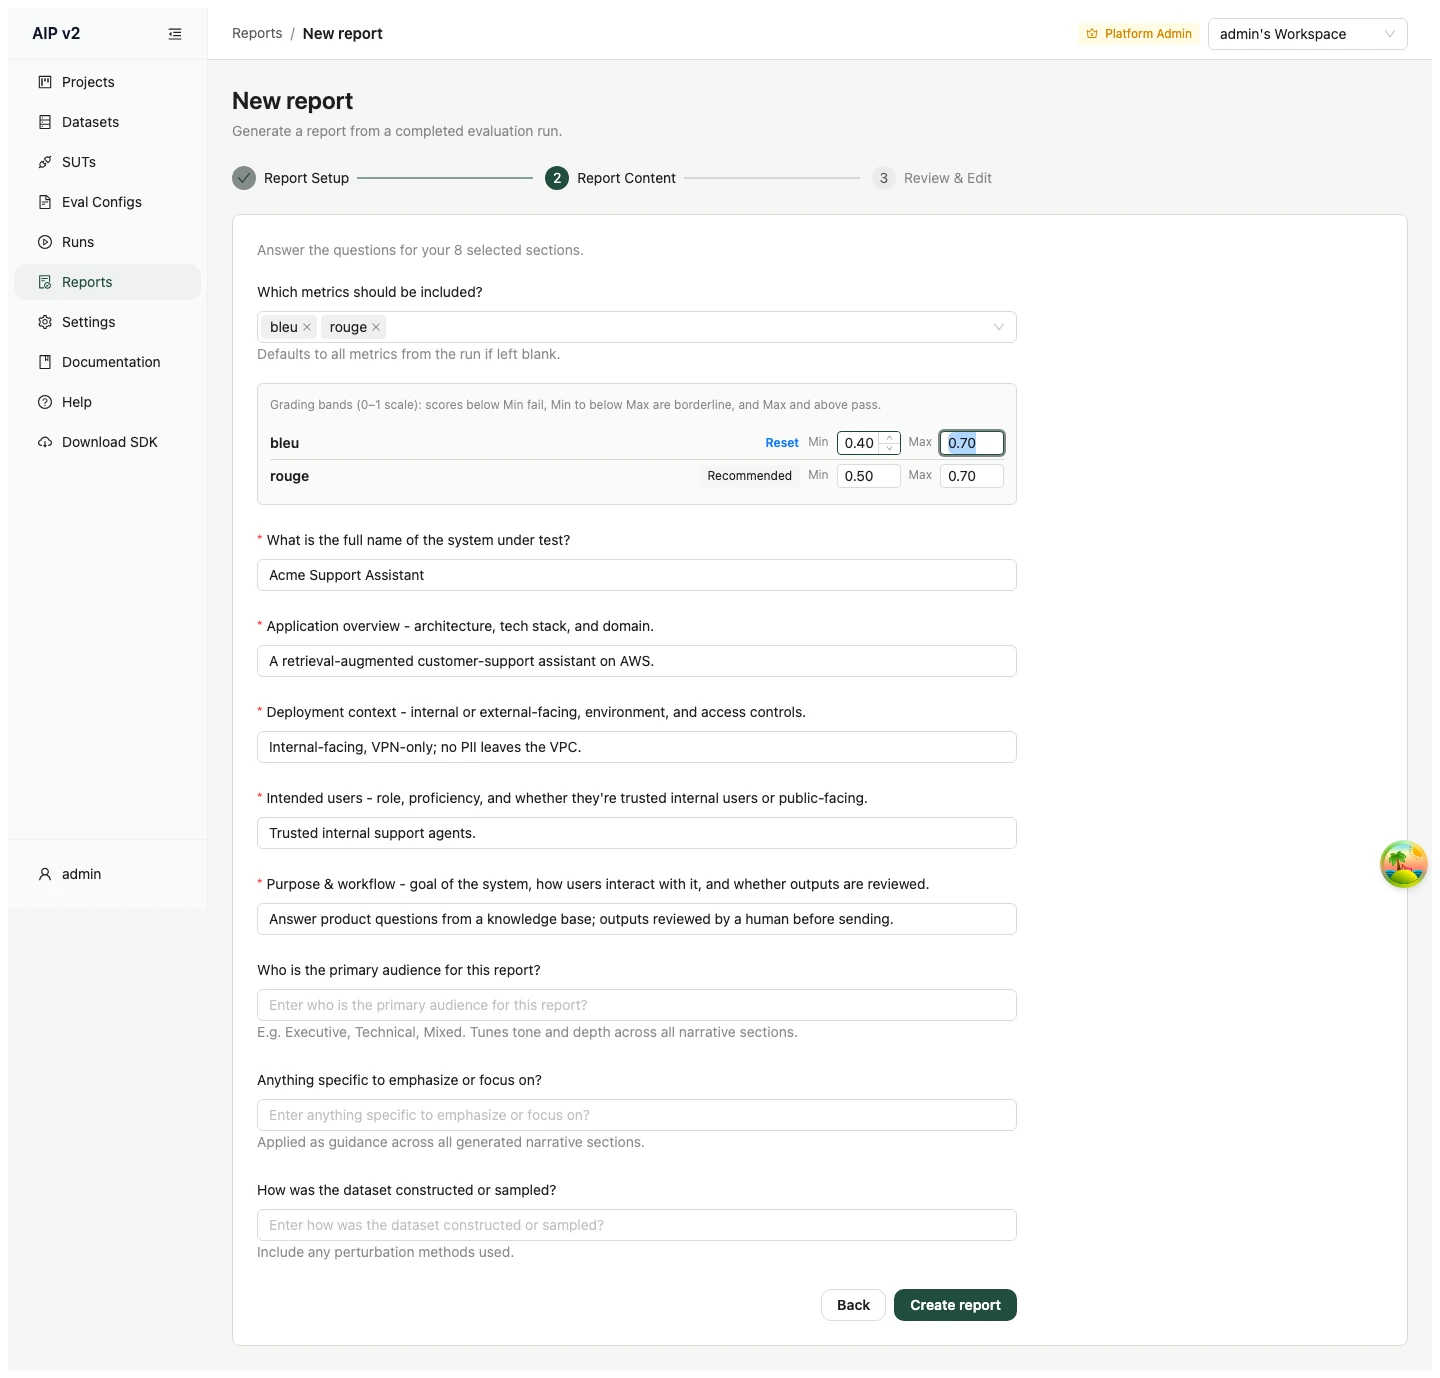
Step 2 — Report Content. A single flat form asks only for what your selected sections need. Required fields are marked * with helper text under each:
- Which metrics should be included? — an optional multi-select; defaults to all of the run's scorer metrics if left blank (disabled with a note when the run exposes none).
- Grading bands (per-metric thresholds) — for each quality metric, a Min / Max pair on the 0–1 scale defines the fail / borderline / pass bands the report grades on. Each metric starts on its Recommended defaults (shown as a tag); edit Min or Max and it flips to a customised band with a Reset link to restore the defaults.
- System description — required free-text covering the system's name, application overview, deployment context, intended users, and purpose & workflow.
- Tone & focus — optional primary audience (tunes tone/depth), anything specific to emphasise, and dataset methodology notes.
Click Create report to queue generation. The report is created and you're taken to Review & Edit (its own /reports/{id}/review URL), which polls while the report generates and then opens the editor automatically. Use Back to revise your run/section choice (your answers are preserved).
📝 Reviewing & Editing a Report
A completed report opens in the on-platform editor — the report rendered exactly as it will export, with your branding, straight in the browser (no PDF plugin). This is also the single source of truth for the preview: what you see here is what the export contains.
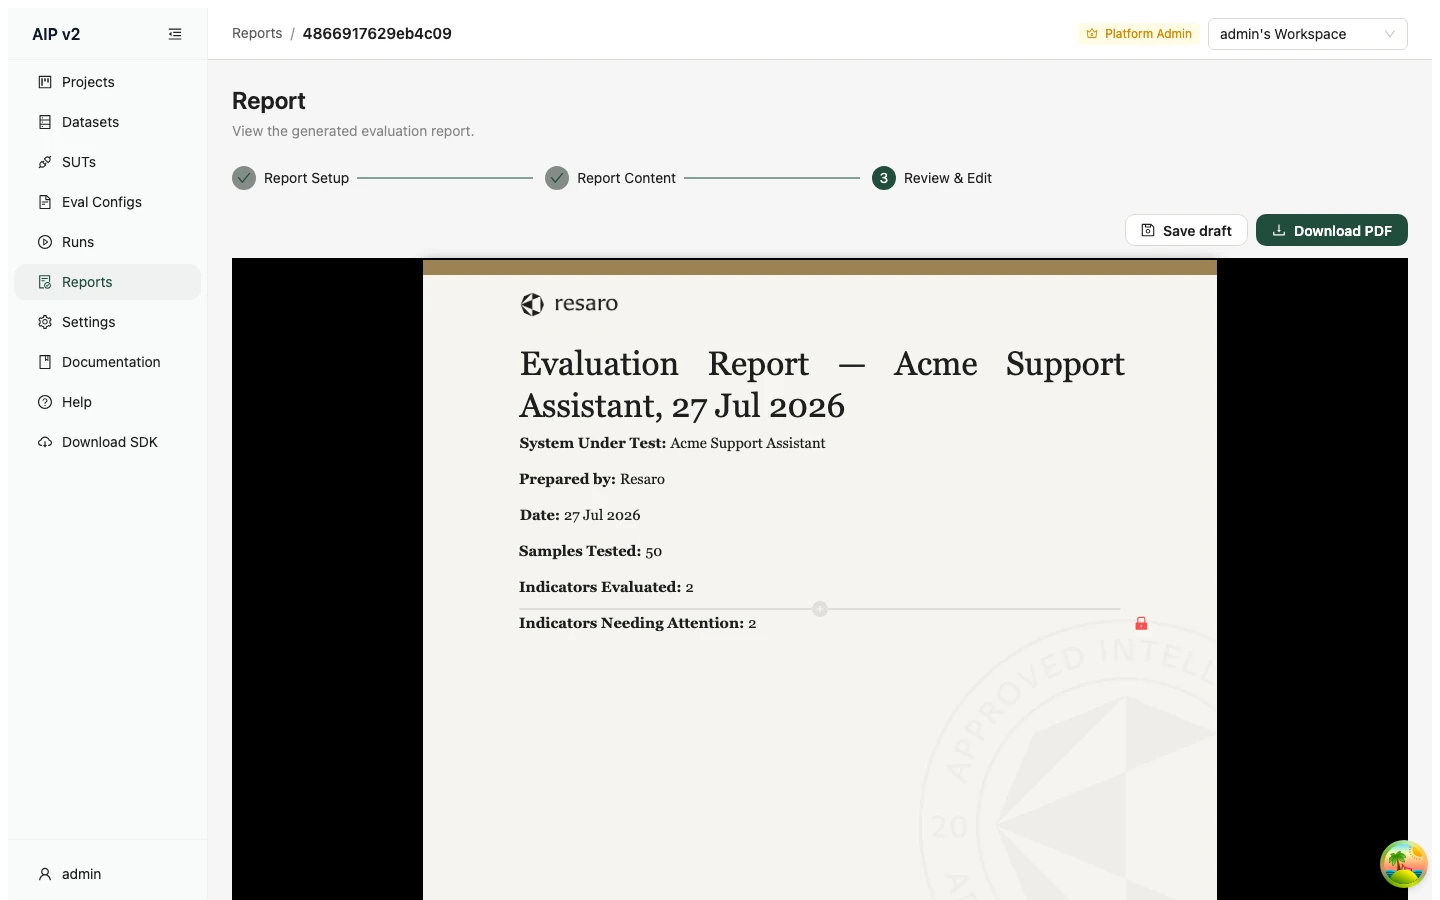
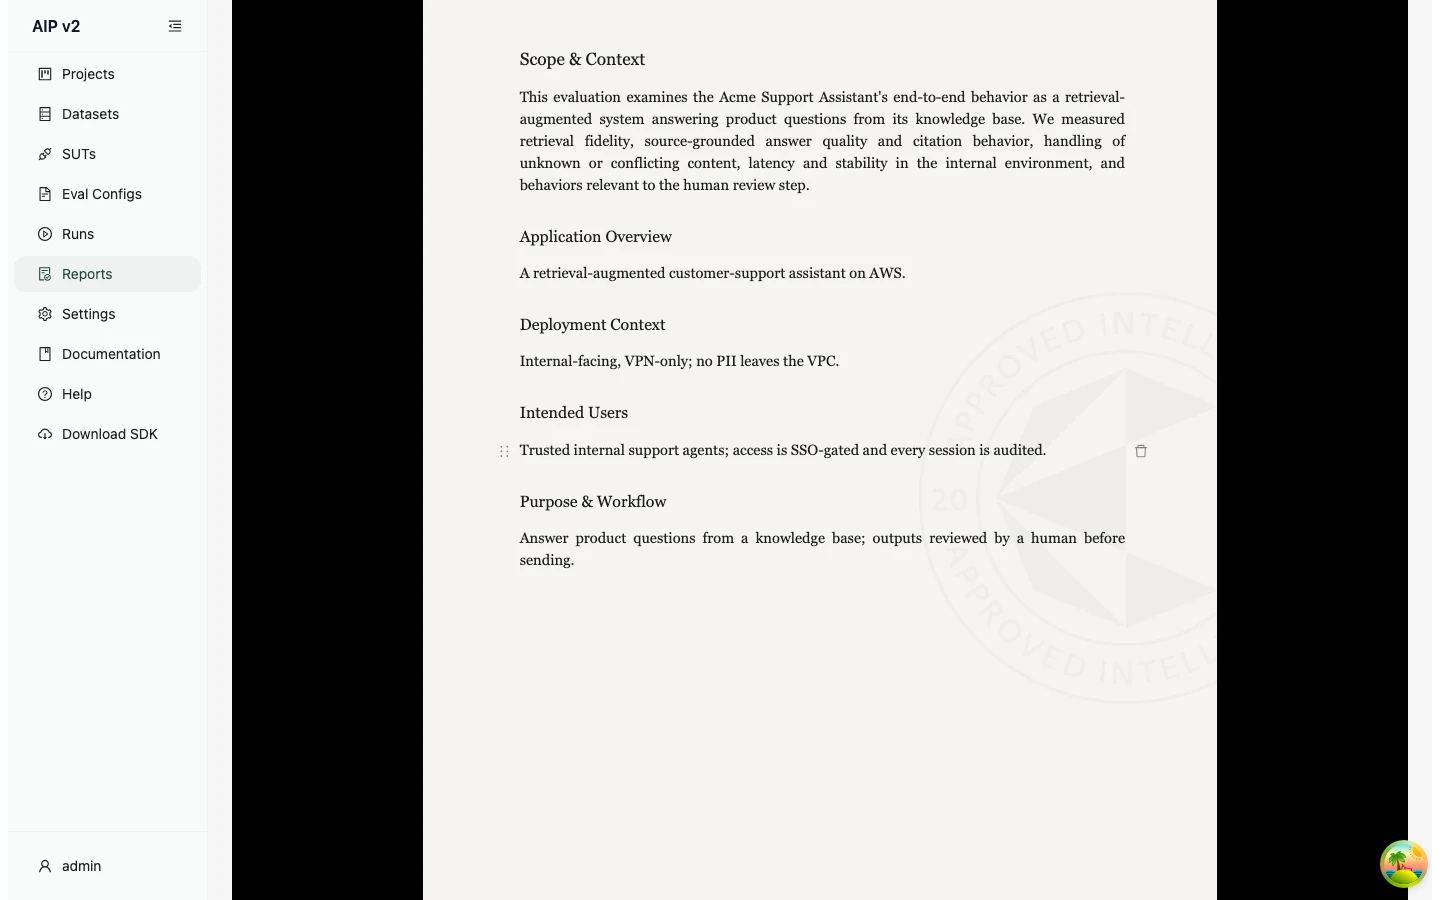
Editing. Narrative prose is directly editable — click into a paragraph and type. Blocks that carry the evaluation result (score tables, charts, example cases) are locked, so edits can never rewrite the numbers. Each editable block has a drag handle and a remove control on hover, so you can also reorder or drop prose blocks. Here the Intended Users paragraph has been edited on-platform:
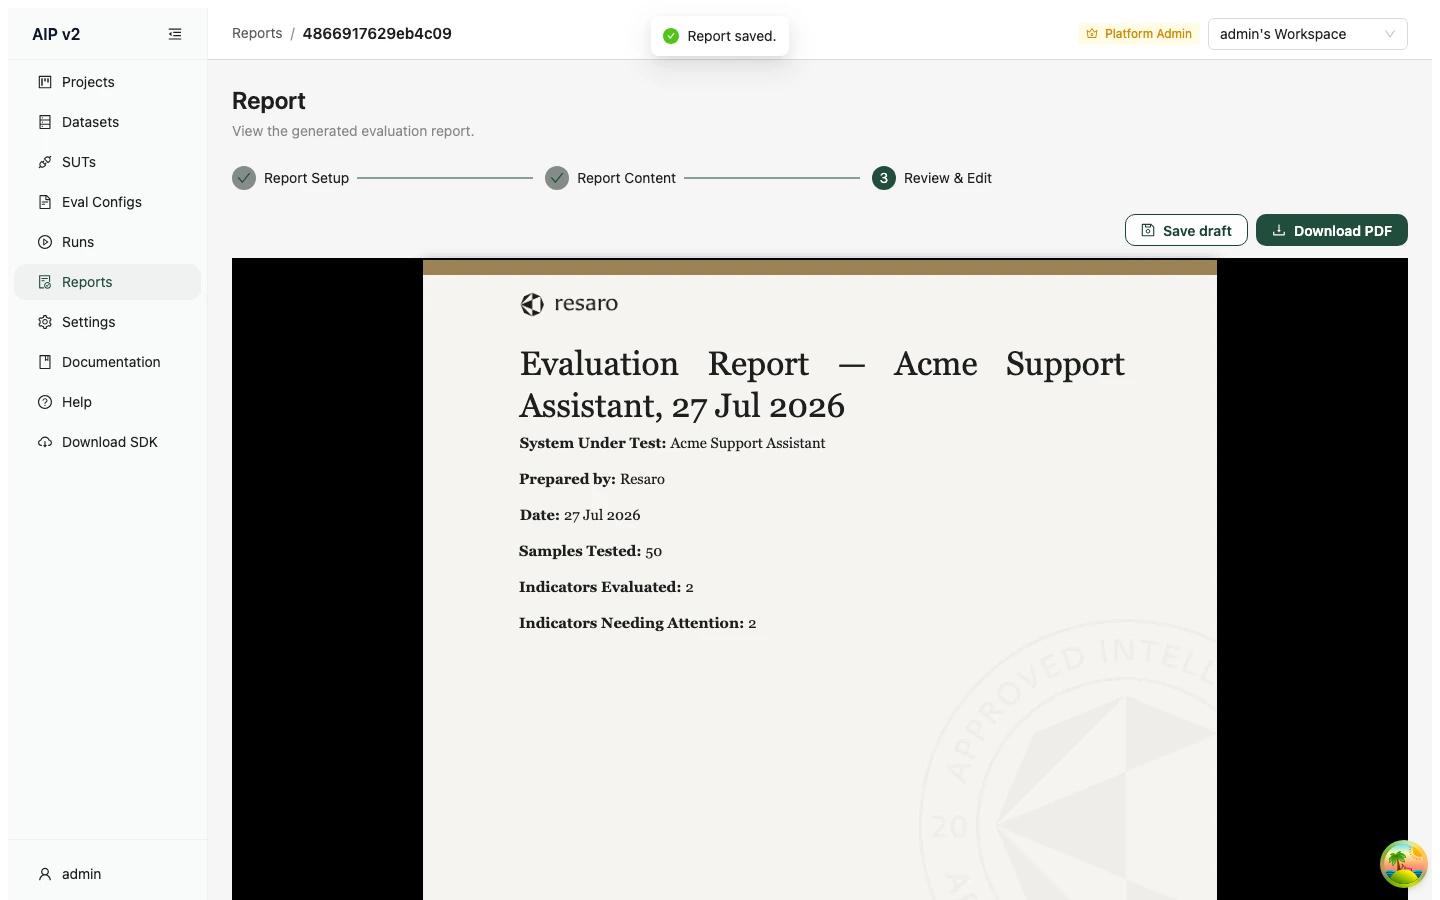
Saving — sticky overrides. Save draft persists your edits as a per-section override layer on top of the AI draft. Overrides are sticky: if the report is regenerated, your edited sections keep your prose while the locked result blocks refresh to the new data. (An edit is stored only for the sections you actually changed; the rest continue to track the AI draft.)
📄 Export & Provenance
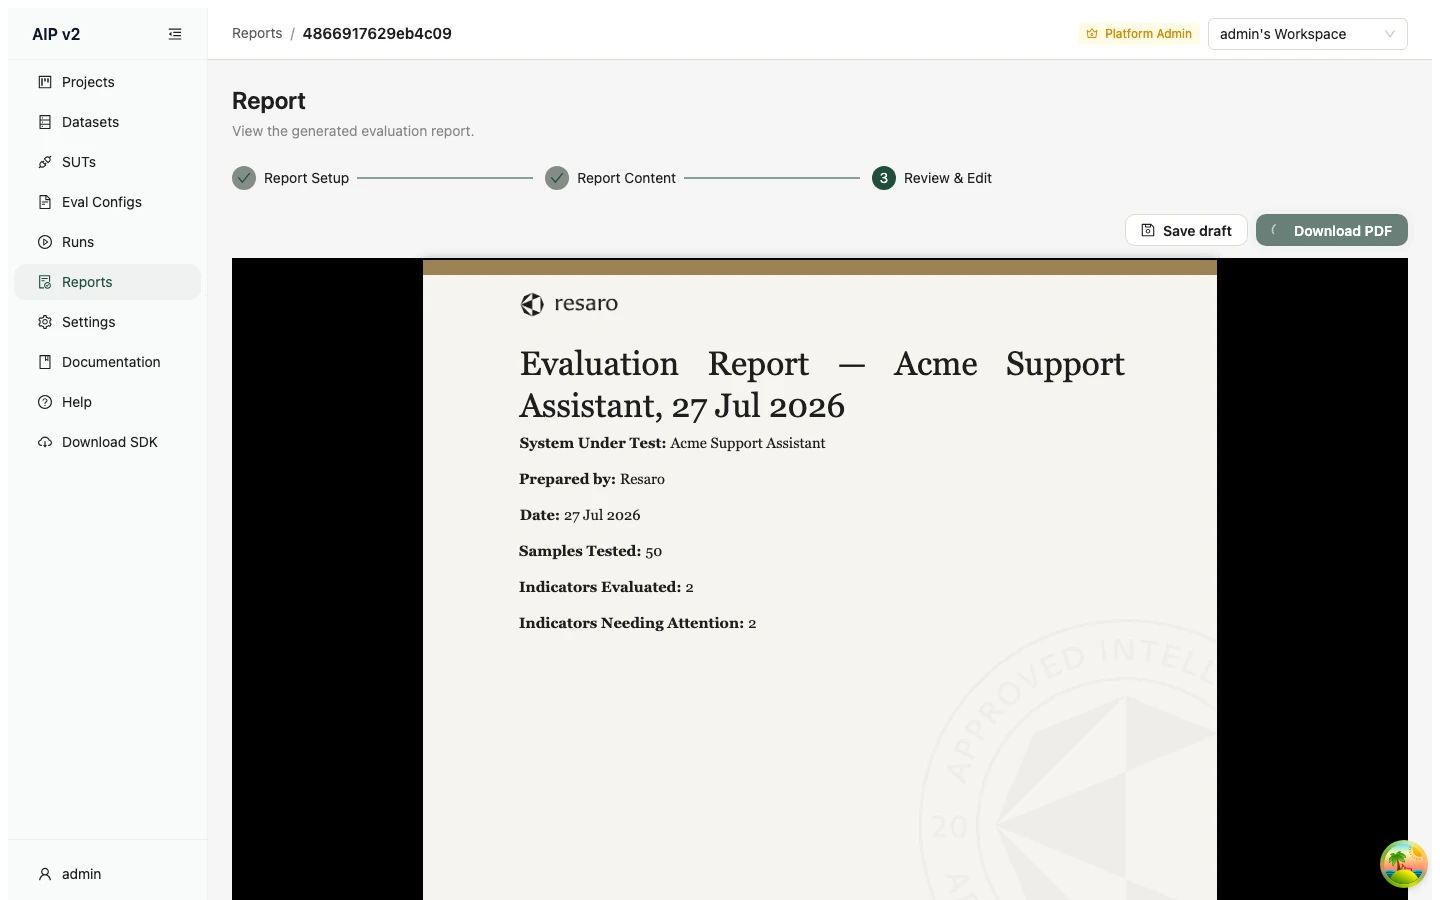
Download PDF exports the report — compositing your edits over the AI draft and rebuilding the branded PDF — then downloads it. The file name is set by the server ({sut}-{report id}-{date}.pdf). Because the export is built from the same content as the on-platform preview, the two always agree: the preview is not a separate approximation of the PDF, it is the same document rendered in the browser.
Every export ends with a Report Provenance footer, so the document is self-describing — it always records exactly how it was produced, regardless of which sections you kept:
- Source run — the evaluation run the report was built from.
- Evaluation date — when that run was evaluated.
- Applied scoping — the metric subset and any custom pass/fail thresholds (or a note that thresholds were reset to the platform defaults).
- Detail level — the exact section selection (e.g. "Custom selection, 8 of 9 sections: …" when you deselected any, or "Full report" when you kept them all).
- Generated at — the UTC timestamp of the export.
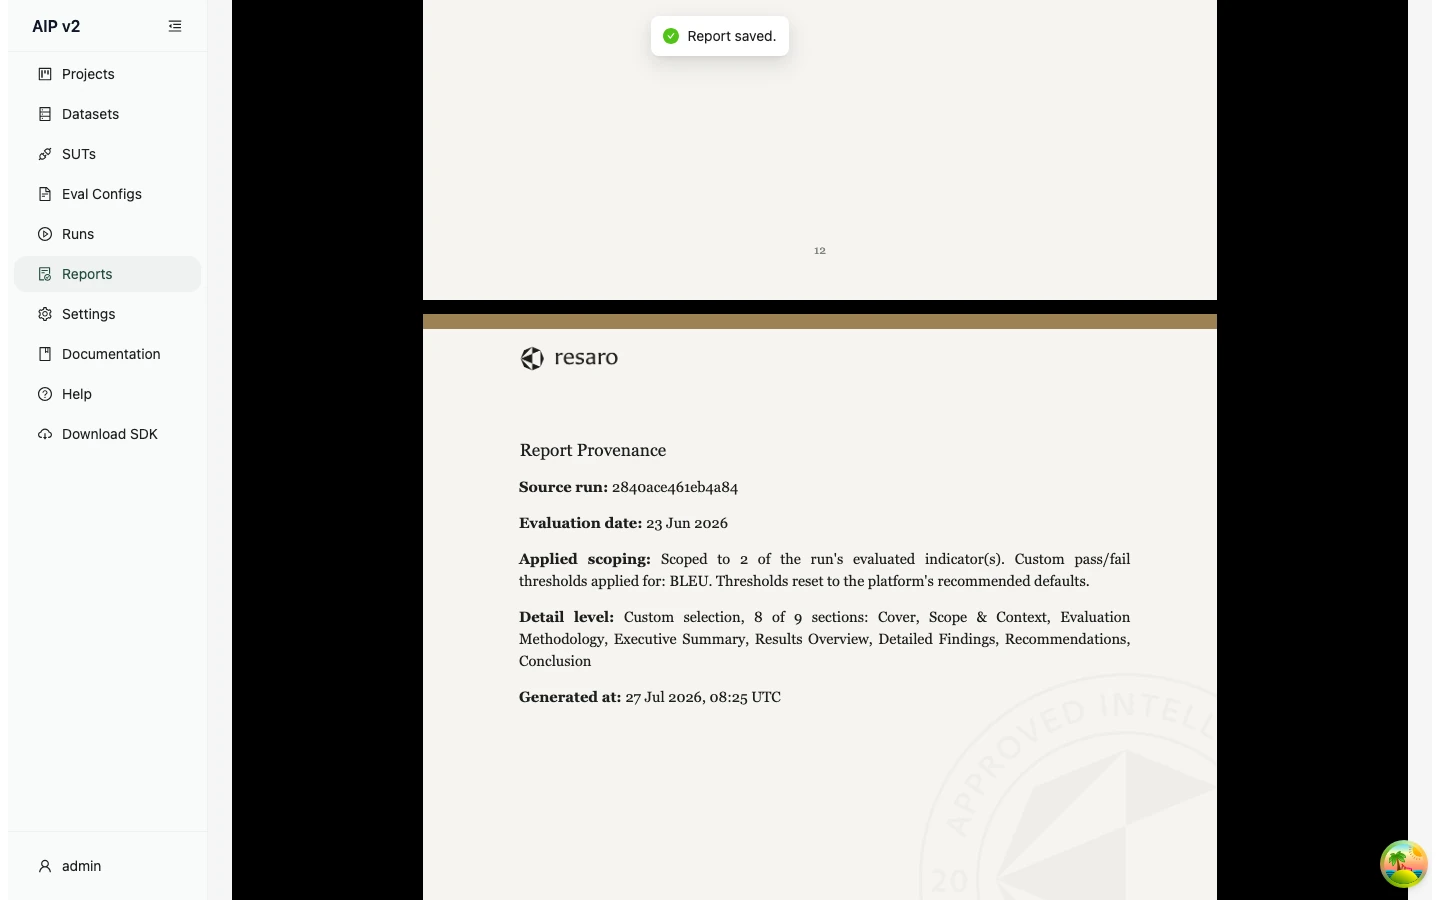
The Report Builder is UI-only — there is no SDK equivalent for generating reports.
⚙️ Settings
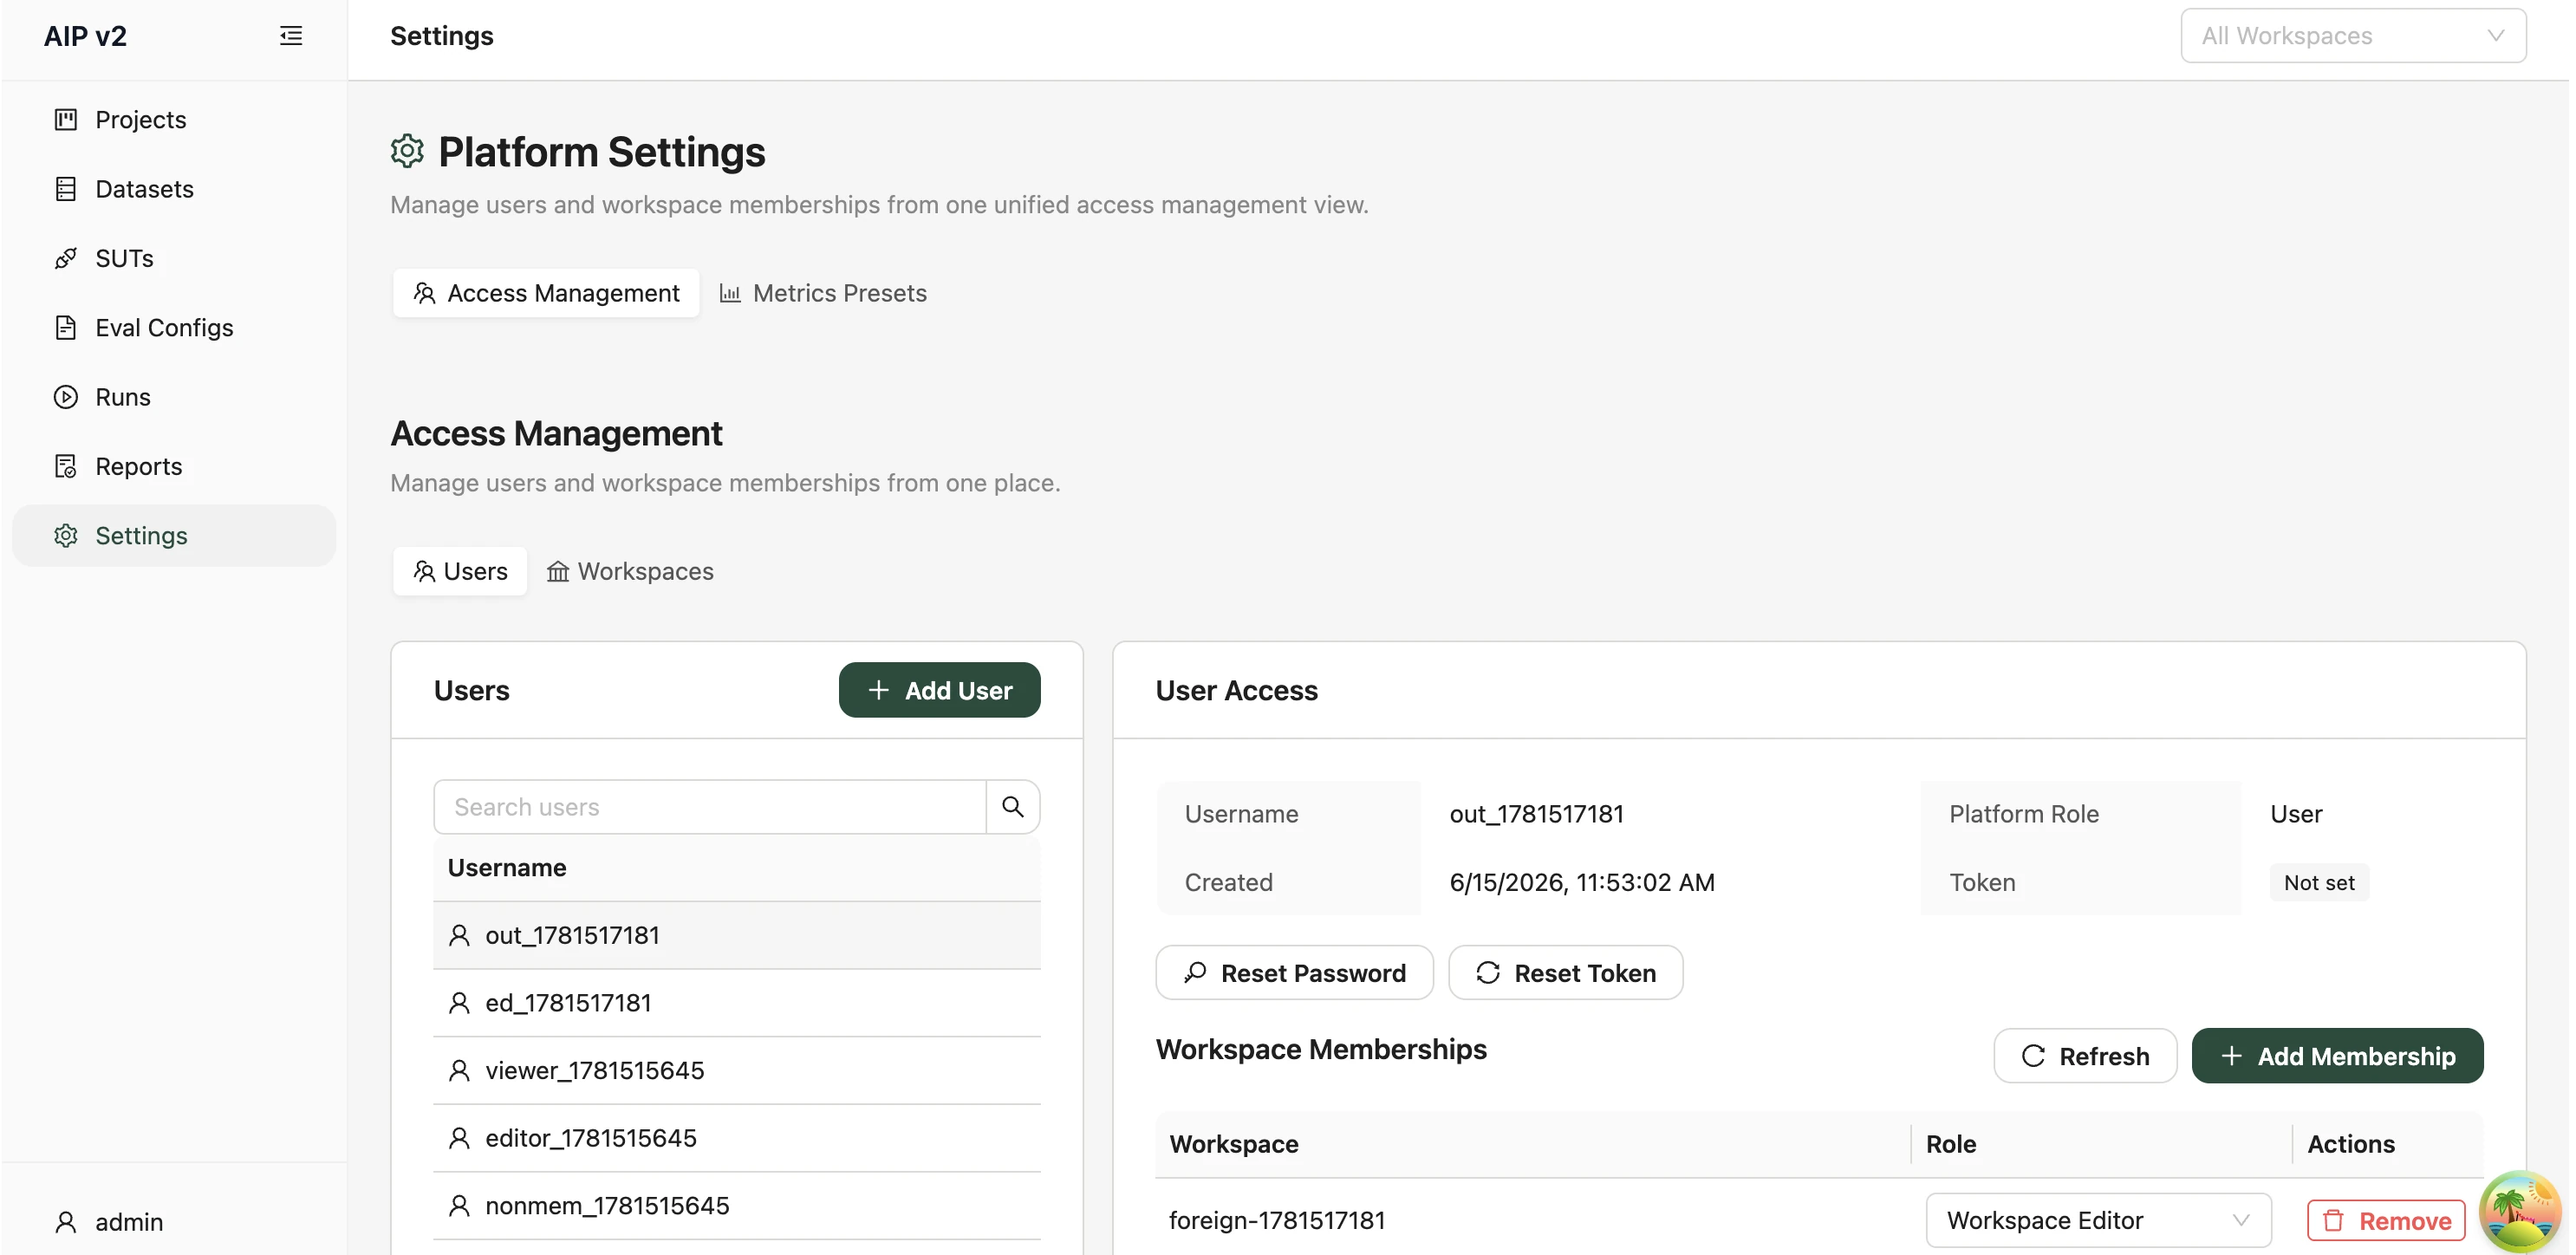
The Settings page (/settings, titled Platform Settings) has two tabs: Access Management and Metrics Presets. What you can do depends on your role.
👥 Access Management
The unified access-management view manages users and workspace memberships:
- Platform admins get both a user-centric and a workspace-centric view (toggle between them), and can create users.
- Non-admins see the workspace-centric view for the workspaces they administer.
For each workspace you can add members and set their role — Workspace Admin, Workspace Editor, or Workspace Viewer — and change or remove an existing member's role.
📊 Metrics Presets
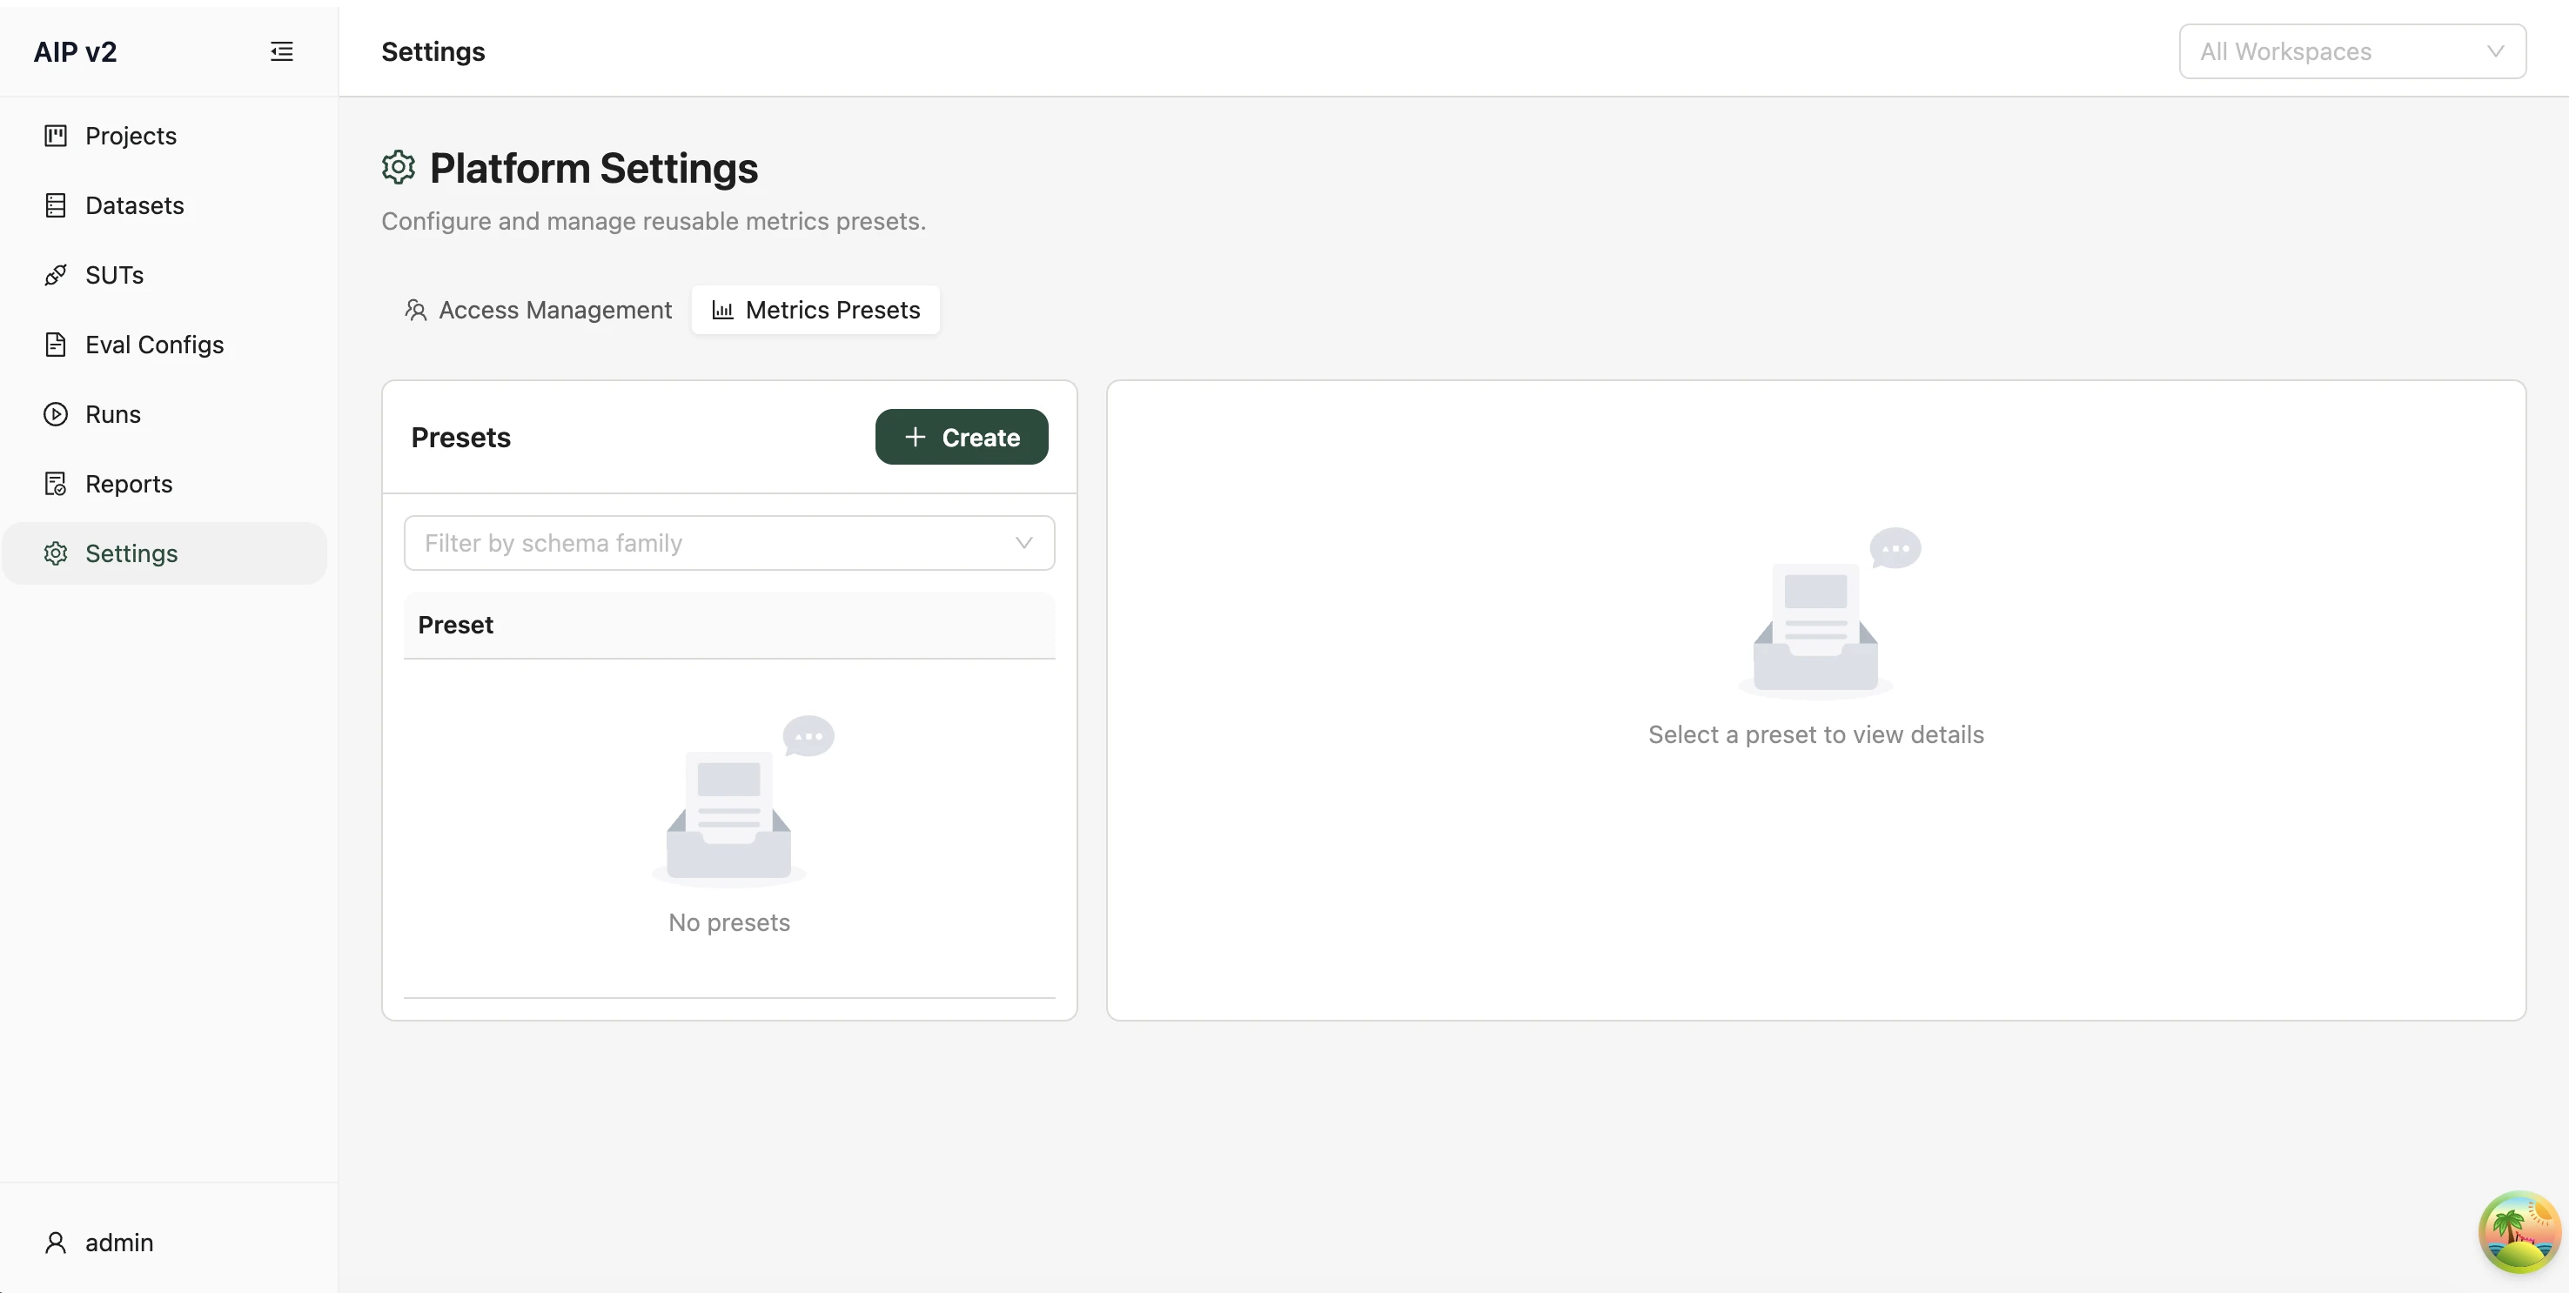
Metrics Presets manages reusable bundles of scorers (the platform's test-package recommendations) — the same presets that appear as one-click chips on the New Run page. The tab lists saved presets in a table, with a schema-family filter, a Create button, and Edit / Delete actions on each preset. Creating or editing a preset opens a form where you name it, set its schema family, and choose the metrics it bundles.
SDK equivalent: workspace membership via
Workspace.add_member()/update_member_role(); presets via the test-package recommendation helpers (aip.create_recommendation()). See the SDK reference for Workspace and create_recommendation.